
Qt Tutorial - Qt Charts
Learn to create various charts in Qt, including bar, pie, and line charts, with detailed coverage of chart attributes and customization options.
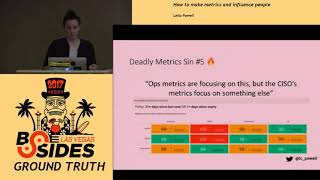
How to Make Metrics and Influence People
Learn effective data analysis techniques to create impactful metrics that drive action and improvement. Gain insights on avoiding common pitfalls and aligning metrics with processes for better decision-making.

How to Create an Editable Pie Chart in Adobe Illustrator
Master editable pie charts in Adobe Illustrator: create, stylize, and customize with the Pie Graph Tool, Direct Selection Tool, and Appearance panel. Learn to add legends and backgrounds for professional infographics.
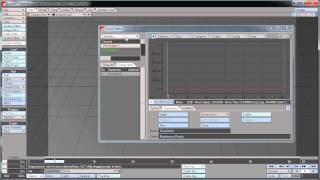
Creating a Dynamic Pie Chart Effect Using Lightwave 3D and Adobe After Effects - Day 1
Learn to create dynamic pie charts using Lightwave 3D and After Effects. Master modeling, slicing, radial arrays, morph maps, lighting, UI design, and expressions for interactive data visualization.

Plotly Tips - Exploratory Data Analysis
Explore data visualization techniques using Plotly library for tips dataset analysis. Learn to create various chart types and gain insights through hands-on exploratory data analysis.