Effortless Open Source Observability with Cilium, Prometheus and Grafana
Discover how Cilium leverages eBPF to provide seamless observability for applications using Prometheus metrics, without code modifications. Learn to monitor service connectivity and collect tracing data with open-source tools.
Using OpenTelemetry for Application Security - A Real-Life Example
Explore OpenTelemetry's role in securing cloud-native applications. Learn how to detect vulnerabilities in microservices architectures through a practical Kubernetes example and Jaeger visualization.
OTel Me About Metrics - A Metrics 101 Crash Course
Comprehensive introduction to OpenTelemetry metrics, covering instruments, measurements, and their practical applications. Clarifies complex concepts with real-world examples for effective implementation.
Jaeger: The Future with OpenTelemetry and Metrics
Explore Jaeger's evolution with OpenTelemetry, including trace-derived metrics, operational monitoring, and the new Prometheus-powered UI. Learn best practices for scalable trace pipelines and auto-instrumentation.
Continuous Profiling Your Production Kubernetes Deployments Running at Scale
Explore continuous profiling for Kubernetes deployments, its benefits, open-source options, and real-life examples of improving system efficiency in large-scale production environments.
Distributed Tracing Integration with OpenTelemetry and Knative
Explore distributed tracing integration using OpenTelemetry for serverless functions. Learn to collect and visualize telemetry data, deploy reactive serverless functions, and leverage Jaeger for enhanced observability in complex cloud-native environments.
Cloud Native Live - Open Telemetry
Explore OpenTelemetry's role in cloud-native observability, covering its components, implementation, and benefits for modern distributed systems and microservices architectures.
Practical Introduction to OpenTelemetry Tracing
Learn to implement OpenTelemetry tracing in distributed systems, exploring its importance, compatibility with existing tools, and practical applications in microservices architectures.

Boosting Engineering Efficiency with OpenTelemetry, Keptn and Tyk
Explore how OpenTelemetry, Keptn, and Tyk can enhance engineering productivity and streamline cloud-native development processes for improved efficiency and performance.
Extending Observability to the Application Lifecycle with ArgoCD, Flux and Keptn
Enhance GitOps observability with Keptn: end-to-end traceability, deployment metrics, and lifecycle hooks for improved application management in Kubernetes environments.
Building a Kubernetes Operator for Automated Distributed Tracing
Learn to implement automated distributed tracing in Kubernetes using a custom operator. Explore advanced techniques for injecting OpenTelemetry, mutating webhooks, and resource management across multiple languages.
Context Propagation in OpenTelemetry - Beyond Hello World Examples
Explore context propagation in OpenTelemetry for distributed tracing, addressing real-world challenges and providing practical solutions to ensure seamless integration and unbroken traces in complex systems.
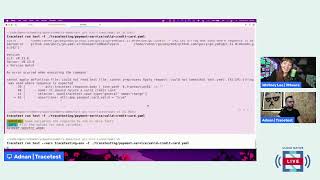
The Power of Traces - Why OpenTelemetry Embraced Trace-Based Testing
Explore trace-based testing in OpenTelemetry, understanding its significance and implementation for improved observability and debugging in cloud-native applications.
Uncovering Hidden OTel Traces - Leveraging Prometheus in a Standardized Manner
Explore advanced techniques for leveraging Prometheus with OpenTelemetry, enhancing observability and uncovering hidden traces in cloud-native environments.
OpenTelemetry and Epsagon - A Journey in Observability
Explore Epsagon's journey with OpenTelemetry, from adoption challenges to becoming part of the community. Learn valuable insights on leveraging open-source projects for observability and avoiding common pitfalls.
Customer Centric Observability at Scale Leveraging AIOps and OpenTelemetry
Explore how Intuit leverages OpenTelemetry and AIOps for real-time customer experience monitoring, anomaly detection, and rapid issue resolution in complex infrastructure environments.
First Steps with Observability - OpenTelemetry and You
Explore observability in cloud architecture using OpenTelemetry. Learn why it matters, how it differs from logging, and where to send data for better system understanding and troubleshooting.
Controlling Data Overhead with the OpenTelemetry Collector
Learn to optimize OpenTelemetry data management: filter PII, clamp metrics, structure data, and process critical events using the collector for efficient observability practices.
How Testability Drives Observability
Explore trace-based testing to enhance OpenTelemetry data quality, improve test coverage, and boost system observability through a live coding demonstration of failure scenario analysis and instrumentation refinement.
Adding OpenTelemetry to Production Apps - Lessons Learned
Discover practical insights and best practices for integrating OpenTelemetry into production applications, enhancing observability and performance monitoring.
Implementing Observability for Microservice Applications on Kubernetes
Learn to implement observability in Kubernetes microservices using Open Telemetry, exploring tracing libraries, distributed systems, and deployment patterns for enhanced application monitoring.