Open Source Java Frameworks: Modern Observability Practices
Explore modern observability practices for open-source Java web applications. Learn to use Open Telemetry and JVM-level insights for performance monitoring and transparency in production environments.

Python Observability Perfected: Advanced Techniques with OpenTelemetry
Master advanced OpenTelemetry techniques for Python microservices. Enhance system monitoring, troubleshooting, and performance tracking in distributed environments.
Tracing Issues in Your Application
Discover effective techniques for tracing and debugging issues in your applications, enhancing your problem-solving skills and improving software reliability.
What's New in Recent and Upcoming HBase Releases
Explore new features in HBase 3.0.0 and 2.6.0, including OpenTelemetry tracing, region replication, cloud-native support, and improved object storage. Learn about upcoming developments for enhanced cloud compatibility.
Using OpenTelemetry on Kubernetes - DevNation Tech Talk
Explore distributed tracing with OpenTelemetry on Kubernetes for effective troubleshooting and observability in complex cloud-native applications.

Developing with Quarkus, Microprofile and OpenTelemetry - Observability Best Practices
Explore observability in Quarkus applications: learn Microprofile Health, Metrics, Fault Tolerance, and tracing. Master instrumenting, business metrics, and Micrometer for enhanced application monitoring.

Developing with Quarkus, Microprofile and OpenTelemetry - Observability Best Practices
Explore observability in Quarkus apps: health checks, metrics, fault tolerance, tracing. Learn best practices for transactions, business metrics, and application flow.
Distributed Tracing with Grafana Tempo and OpenTelemetry
Explore distributed tracing using Grafana Tempo and OpenTelemetry for cloud-native apps. Learn to collect RED metrics and traces without code changes for improved observability.
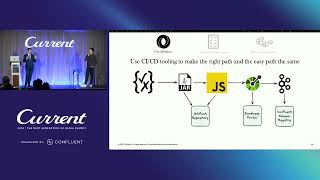
Beyond Monoliths: Thrivent's Lessons in Building a Modern Integration Architecture
Explore strategies for modernizing data architecture, from technical aspects like JSON Schema and OpenTelemetry to human factors like building trust and adopting a product-focused mindset.
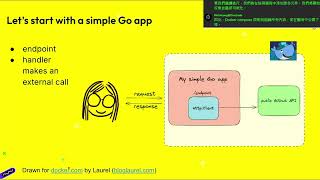
Getting Started with OpenTelemetry: Instrumenting, Collecting, and Visualizing Telemetry Data
Instrument, collect, and visualize telemetry data using OpenTelemetry in Golang applications. Learn strategies for effective implementation and data analysis.
Observing and Optimizing Drupal 8 Websites with OpenTelemetry, Monolog, and Grafana
Implement observability in Drupal using OpenTelemetry, Monolog, and Grafana to track complex requests, optimize performance, and troubleshoot distributed architectures effectively.

Introduction to OpenTelemetry in .NET
Enhance .Net application monitoring with OpenTelemetry, an open-source observability framework for cloud-native software. Capture and export telemetry data to improve project insights.

MLOps on Azure Machine Learning Studio
Automate and streamline machine learning lifecycle with MLOps on Azure ML, integrating ML, DevOps, and Data Engineering for consistent, high-quality model delivery.
Level Up Your Observability with OpenTelemetry
Discover OpenTelemetry's power for enhanced observability. Learn implementation strategies, from automatic to manual instrumentation, and effective rollout techniques for improved system visibility.
Measuring IDP Success with OpenTelemetry, DORA, and SLOs
Learn to measure IDP success using OpenTelemetry, DORA metrics, and SLOs. Explore how Keptn leverages observability for efficient GitOps deployments and workload orchestration on Kubernetes.
Database Guardrails - A New Era for Developers and Databases
Explore OpenTelemetry-based database guardrails to validate data access, ensure scalable queries, and automate observability for improved SDLC and troubleshooting.
Scaling Developer Testing for Microservices in Kubernetes
Leverage OpenTelemetry and Service Mesh for concurrent microservice testing in Kubernetes. Explore real-world strategies for managing hundreds of microservices and organizing comprehensive testing approaches.
GenAI for Observability in the Serverless World
Harness GenAI to enhance serverless observability, leveraging vector databases and ML for improved data ingestion, log analysis, and problem resolution.
Observability for Troubleshooting and Optimization with OpenTelemetry
Explore OpenTelemetry for enhanced DevOps observability, troubleshooting, and optimization in Google Cloud, covering instrumentation, trace exploration, adoption strategies, and deployment patterns.
How Observability Empowers Security - Leveraging OpenTelemetry in GKE Clusters
Explore how OpenTelemetry enhances visibility and security in GKE clusters, combining application data with cloud-native stack layers for improved observability.
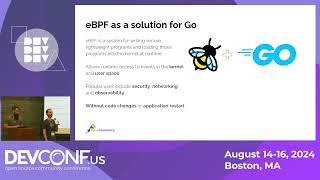
Auto-Instrumenting Go Libraries for Tracing with eBPF and OpenTelemetry - Lecture 1
Explore auto-instrumentation for Go using eBPF and OpenTelemetry, enabling context propagation and tracing without code changes or restarts. Learn technical details, challenges, and future plans.