OpenTelemetry - An Observability Framework for Cloud-Native Software
Explore OpenTelemetry, a vendor-agnostic observability framework for cloud-native software. Learn about its specification, integration with frameworks, and focus on solving operational challenges in distributed architectures.
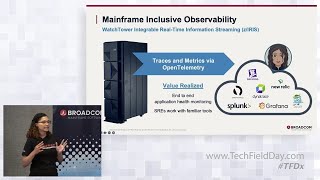
Real-time Streaming with OpenTelemetry Framework - WatchTower's Integration for Enterprise Observability
Discover how WatchTower's OpenTelemetry framework enables real-time monitoring of mainframe applications, integrating performance data for comprehensive enterprise-wide observability and workflow management.
Integrating the Apache Cassandra Java Driver with OpenTelemetry for End-to-End Tracing
Discover how to implement end-to-end tracing by integrating Apache Cassandra Java Driver with OpenTelemetry, enhancing application observability and performance monitoring capabilities.
Approaching Cloud-native RabbitMQ
Explore RabbitMQ as a centerpiece of serverless/cloud technologies, focusing on Knative integration, Cloudevents ecosystem, Observability frameworks, and OpenTelemetry Messaging Semantic Conventions.
Powering Cisco ThousandEyes High-Performant Data Streams with gRPC and OpenTelemetry
Explore high-performance data streaming using gRPC and OpenTelemetry in Cisco ThousandEyes. Learn to manage heavy traffic and adapt to changing test configurations in shared environments.
Achieving 99.99% Uptime with Open Source Observability
Explore OpenTelemetry for achieving 99.99% uptime in distributed systems. Learn to collect, process, and export telemetry data for enhanced visibility and quick issue resolution.
Keeping an Eye on Your Cloud Native Applications with OpenTelemetry
Explore OpenTelemetry for cloud native application monitoring. Learn architecture, instrumentation, key features, and vendor-agnostic data collection for improved performance and debugging.
Maximize Lunchtime and Minimize War Rooms - Empower Efficiency with Full-Stack Observability
Empower efficiency with full-stack observability. Learn how Cisco FSO Platform extends to the evolving digital landscape, providing control and visibility for reliable, secure business applications.
Modern Application Debugging: An Introduction to OpenTelemetry - DevOpsDays NYC 2023
Explore OpenTelemetry for modern application debugging. Learn to instrument microservices, collect metrics, traces, and logs, and analyze telemetry signals using open-source tools like Jaeger and Prometheus.

Implementing Distributed Tracing with OpenTelemetry in .NET Applications
Integrate OpenTelemetry for distributed tracing in .NET, enhancing observability and pinpointing performance issues across microservices in complex environments.
Developer-Ready Platform Microservice Template - Benefits and Implementation
Explore a low-code framework for microservices in cloud-native platforms. Learn how it boosts productivity, reduces costs, and simplifies complex technologies for developers.
OpenTelemetry Native Observability
Enhance platform performance with OpenTelemetry. Learn core concepts, architecture, and practical implementation for comprehensive observability in cloud-native software development.
Platform Engineering at Dynatrace - What We've Learned So Far
Discover how Dynatrace leveraged Backstage for platform engineering, impacting R&D, post-sales, and sales enablement teams while solving business problems and demonstrating value at scale.
Extend Cloud Run Containers' Capabilities Using Sidecars
Enhance Cloud Run containers with sidecars for custom tracing, monitoring, logging, networking, security, and routing. Learn how Nasdaq benefited from Envoy sidecars.

What's New in Strimzi 0.32.0 - Features and Updates
Explore new features in Strimzi 0.32.0, including Kubernetes support, Control Plane Listener, Rebalance Auto-Approvals, OpenTelemetry, and cluster-ip type listener. Learn about upgrades and Apache Kafka versions.
Observability for LLMs - Lightning Talk
Explore observability techniques for LLMs, including instrumentation, telemetry analysis, and OpenTelemetry integration. Learn to enhance reliability and gather crucial evaluation data for AI systems.
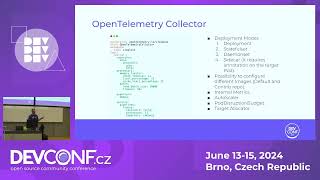
Auto Instrumentation for NodeJS Applications on Kubernetes
Enhance Node.js app monitoring on Kubernetes using OpenTelemetry for auto-instrumentation, improving log generation and metric collection for precise performance analysis.
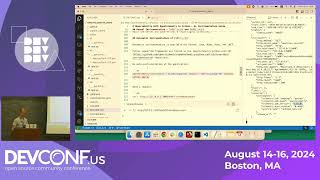
Observability and Instrumentation via OpenTelemetry - Lecture 1
Explore observability basics, instrumentation, and OpenTelemetry standardization. Learn to implement tracing in Python with open-source examples.
Implement Auto Instrumentation Under GraalVM Static Compilation on OTel Java Agent
Explore GraalVM static compilation's impact on Java applications and learn about a static instrumentation solution for OTel Java Agent, enhancing performance in cloud-native environments.
What Could Go Wrong with a GraphQL Query and Can OpenTelemetry Help?
Explore challenges in GraphQL production, learn how OpenTelemetry can help troubleshoot performance issues, and discuss improvements for better GraphQL monitoring and reliability.
GraphQL Observability with Elastic and OpenTelemetry
Explore implementing comprehensive observability for federated GraphQL APIs using OpenTelemetry and Elastic, enabling proactive performance management and error detection.