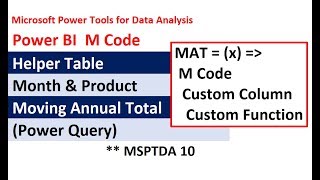
Power BI M Code for Moving Annual Total - Custom Function Power Query Custom Column
Learn to create custom functions in Power BI for calculating Moving Annual Totals using M code. Master advanced data transformation techniques and optimize performance with table buffering.
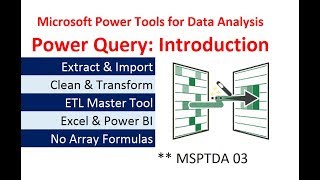
Power Query Introduction - Importing & Transformation Data in Excel & Power BI Desktop
Comprehensive introduction to Power Query for data importing, cleaning, and transformation in Excel and Power BI Desktop, with practical examples and hands-on exercises.
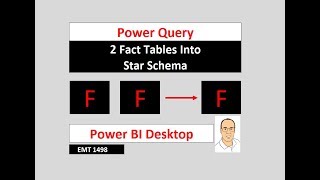
Power Query Power BI - Transform 2 Fact Tables to Star Schema Data Model - Invoice Data
Transform invoice data into a star schema using Power Query, creating a single fact table for improved reporting and analysis in Power BI Desktop.
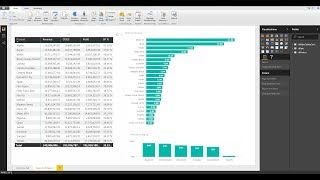
Power BI for Accountants - Complete Introduction to Power BI Desktop to Build Reports & Dashboards
Learn to create dynamic sales reports and dashboards using Power BI Desktop. Master data import, cleaning, transformation, and visualization techniques for effective financial analysis and monitoring.

Visualizations in Power BI - Full Tutorial
Comprehensive tutorial on Power BI visualizations, covering tables, charts, formatting, and interactive elements. Learn to create impactful data presentations and enhance report design for effective business intelligence.
Creating a Power BI Report - Detailed Power BI Tutorial
Learn to design Power BI reports with titles, navigation, visualizations, and charts. Master card filtering, line charts, stacked columns, and treemaps for effective data representation.

Microsoft Power BI for Beginners - Power BI Crash Course
Learn Power BI essentials: data import, transformation, modeling, DAX, visualizations, and publishing. Master key features for effective business intelligence and data analysis in just two hours.

Getting Started in Power BI - Microsoft Power BI Tutorial for Beginners
Comprehensive introduction to Power BI, covering installation, data import, query merging, table relationships, and date handling. Learn to create dynamic dashboards and reports for data analysis and visualization.

Power BI Crash Course for Beginners
Learn to import, analyze, and visualize data using Power BI Desktop. Master data cleaning, DAX, Power Query, and create insightful visualizations for effective business intelligence.
Power BI Professional Tutorial
Comprehensive tutorial on Power BI covering data management, sharing, and visualization. Learn to create dashboards, manage workspaces, and optimize datasets for effective business analytics.

Power BI Expert Tutorial
Comprehensive tutorial on data visualization, from creating reports and dashboards to implementing accessibility features and real-time data streaming in Microsoft's business analytics platform.

Power BI Advanced Tutorial
Advanced Power BI techniques for data analysis and visualization, covering calculated tables, DAX functions, performance optimization, and creating interactive dashboards for effective business intelligence.
Power BI Intermediate Tutorial
Advance your Power BI skills with data shaping, enhancing data structure, designing data models, creating relationships, and implementing Row-Level Security (RLS) for improved data analysis and visualization.
Power BI Beginner Tutorial
Learn to build queries, prep data, create relationships, and develop interactive dashboards using Microsoft's Power BI. Master essential functions for data analysis and visualization in this comprehensive tutorial.
Introduction to Power BI - Microsoft Power Platform Fundamentals Bootcamp
Learn Power BI basics, features, and app installation in this Microsoft Power Platform Fundamentals Bootcamp session. Includes demos and study guide review for PL-900 certification preparation.

Visualizing Data and Building Dashboards in Excel & Power BI
Comprehensive guide to data visualization and dashboard creation in Excel and Power BI, covering various chart types, PivotTables, Power Query, and advanced techniques for effective data presentation.

How to Transform Excel Data into a Striking Visual Report with Microsoft Power BI
Transform Excel data into interactive visual reports using Microsoft Power BI. Learn importing, data manipulation, DAX expressions, chart creation, and report customization in this beginner-friendly tutorial.
Power BI Master Tutorial
Comprehensive tutorial on Power BI, covering data querying, analysis, and visualization. Learn to build relationships, create dashboards, and master advanced functions for effective business analytics.

Power BI Advanced Tutorial
Master advanced Power BI techniques for data analysis and visualization. Learn to build queries, create relationships, use DAX functions, design interactive dashboards, and publish reports online.

Power BI Beginner Tutorial
Learn to process and visualize data using Microsoft's Power BI. Master querying, data prep, relationship building, and creating interactive dashboards and reports for effective business analytics.

Power BI Reports and Dashboards - How to Build Power BI Dashboards
In this tutorial, we will explore some of the ways to create Dashboards and Reports in Power BI.