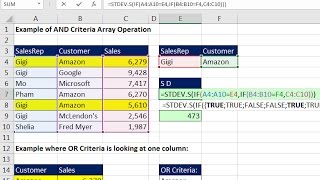
Conditional Calculations with Excel Formulas - Comprehensive Lessons
Comprehensive guide to conditional calculations in Excel, covering AND/OR functions, SUMIFS, array formulas, and more. Ideal for mastering complex data analysis techniques.
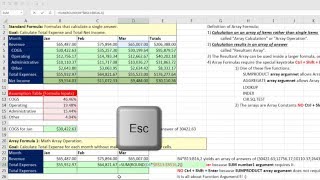
Excel Array Formulas - Comprehensive Lessons with 12 Examples
Comprehensive guide to Excel array formulas, covering 12 practical examples from basic operations to advanced functions like SUMPRODUCT, TRANSPOSE, and FREQUENCY for efficient data analysis.
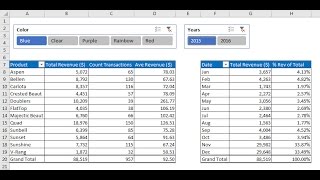
Data Analysis Fundamentals - PivotTables, Power Query & Data Model
Master Excel data analysis with PivotTables, Power Query, and Data Model. Learn sorting, filtering, and advanced techniques to handle large datasets efficiently and create insightful reports.
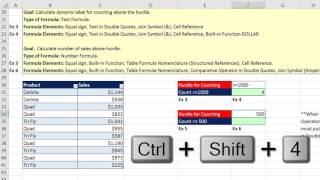
Excel Fundamentals - Comprehensive Formula Lesson
Comprehensive Excel formula tutorial covering 15 examples, including VLOOKUP, IF functions, array formulas, error tracking, and best practices for efficient spreadsheet creation.
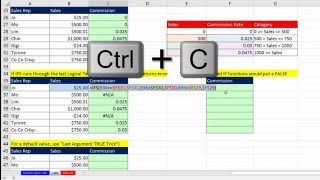
Excel 2016 IFS Functions - Compare and Contrast IF and IFS Functions
Learn to use Excel 2016's IFS function for complex conditional logic, comparing it with IF and VLOOKUP. Explore practical examples and advanced techniques for efficient data analysis and formula creation.
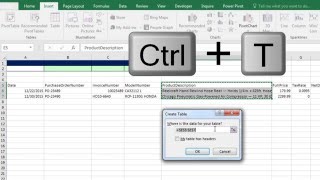
Build Database with Excel Table Feature and VLOOKUP to Get Invoice Detail
Learn to create dynamic databases in Excel using Tables, master VLOOKUP for invoice details, and explore advanced features like structured references and data validation.
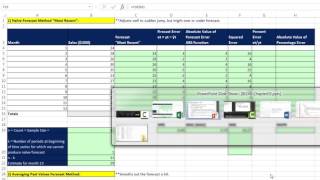
Basic Excel Business Analytics - Basic Forecasting Methods & Measures of Forecast Error
Explore essential forecasting techniques and error measures in Excel, including Naïve Method, Moving Average, and Exponential Smoothing. Learn to calculate and interpret forecast accuracy metrics for improved business analytics.
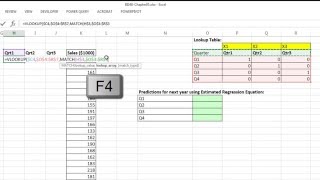
Basic Excel Business Analytics - Forecasting with Linear Regression: Trend & Seasonal Pattern
Learn advanced Excel forecasting techniques using linear regression for trend and seasonal pattern analysis, including FORECAST function and multiple regression with categorical variables.
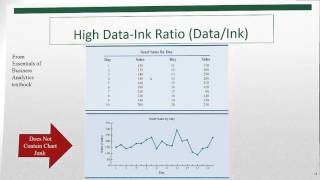
Basic Excel Business Analytics - Visualizing Data: Table & Chart Guidelines
Aprenda diretrizes essenciais para visualização eficaz de dados em Excel, incluindo princípios de design de tabelas, tipos de gráficos e técnicas avançadas como formatação condicional e mapeamento 3D.
Basic Excel Business Analytics - Comprehensive PowerPivot, Data Model, DAX & Reporting Example
Comprehensive guide to PowerPivot: Import big data, build data models, create DAX measures, and generate insightful reports. Master advanced Excel analytics for business intelligence.
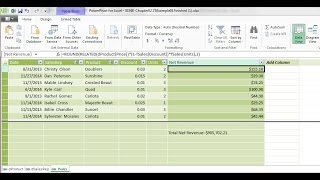
Basic Excel Business Analytics - Introduction to PowerPivot & Data Modeling
Comprehensive introduction to PowerPivot and data modeling in Excel, covering key concepts, DAX functions, and best practices for building efficient and effective data models for business analytics.

Basic Excel Business Analytics - Clean & Transform Data - Formulas, Flash Fill, Power Query, Text To Columns
Aprenda técnicas avançadas para limpar e transformar dados no Excel, incluindo fórmulas, Flash Fill, Power Query e Text to Columns, preparando-os eficientemente para análise.
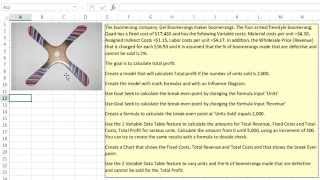
Basic Excel Business Analytics - Good Spreadsheet Model Design, Fixed Variable Cost Example
Learn essential spreadsheet modeling techniques for business analytics, focusing on fixed and variable cost analysis using Excel. Gain practical skills in creating well-designed models for effective decision-making.

Excel XLOOKUP Function – Comprehensive Lessons – 27 Examples
Comprehensive guide to Excel's XLOOKUP function, covering 27 examples from basic usage to advanced techniques like dynamic column retrieval and array formulas.
Running Total in Column - Power Query, DAX or Worksheet Formula?
Learn to create running totals in Excel using worksheet formulas, Power Query, and DAX. Master expandable ranges and cumulative calculations for overall and monthly totals.
Two Fact Tables - DAX, Power Query or Worksheet Formulas to Convert to 1 Fact Table
Learn techniques to convert two fact tables into one using Excel formulas, DAX in Power Pivot, and Power Query in Power BI. Master data modeling and analysis skills for improved business reporting and decision-making.
Power Query - Reduce Data Model Size, Transformations to Columnar Database Size
Learn strategies to optimize data model size using Power Query transformations, enhancing efficiency for big data analysis and business intelligence with columnar databases.
Data Modeling - VLOOKUP, Power Query or Power Pivot?
Learn data modeling techniques using VLOOKUP, Power Query, and Power Pivot for efficient data analysis in Excel. Explore methods for handling multiple tables and creating effective PivotTable reports.
The Magic of Power Query to Import, Transform & Load Data
Learn to import, clean, and transform data using Power Query in Excel. Master techniques for efficient data handling, report creation, and automated updates.
Visualizing Data with Tables, Charts, Conditional Formatting & Dashboards
Learn to create effective data visualizations in Excel using tables, charts, conditional formatting, and dashboards. Master techniques for clear, impactful data presentation and analysis.
PivotTables & Slicers - Create Dashboards & Summary Reports
Master PivotTables, Slicers, and dashboards in Excel. Create cross-tab reports, frequency distributions, and custom calculations for effective data analysis and visualization.