How to Analyze Data in Excel Spreadsheets
Learn essential Excel skills for data analysis: data entry, formatting, formulas, functions, and referencing. Practical exercises included for hands-on experience in spreadsheet manipulation and analysis.
Excel Beginner Tutorial - From Basics to Advanced Features
Comprehensive tutorial covering Excel basics to advanced features, including formulas, functions, data management, charts, and automation techniques for improved efficiency and data analysis skills.
Excel for Beginners - The Complete Course
Comprehensive Excel tutorial covering basics to advanced features. Learn spreadsheet terminology, data entry, formulas, functions, formatting, charts, and publishing options in just 55 minutes.

Pivot Table Excel Tutorial
Learn to create, analyze, and visualize data with Excel Pivot Tables. Master data cleaning, formatting, grouping, and advanced features like Pivot Charts and Slicers in this comprehensive tutorial.

Introduction to Excel VBA Programming
Learn Excel VBA programming essentials: macros, variables, functions, loops, and user forms. Master data manipulation and automation techniques for enhanced spreadsheet functionality.

Excel Shortcuts for Beginners - Essential Tips to Boost Productivity
Master essential Excel shortcuts to boost productivity and streamline your workflow. Learn navigation, data manipulation, formatting, and advanced features for efficient spreadsheet management.

How to Build and Design Charts and Dashboards in Excel
Master Excel data cleaning, custom formatting, and chart creation to transform raw information into visually impactful dashboards and presentations.

Connecting Plotly Graphs to Dash Components
Learn to create interactive data visualizations by connecting Plotly graphs with Dash components. Master various chart types and enhance user interaction in your Python-based dashboards.

Plotly Dashboards
Learn to create interactive dashboards and data visualizations using Plotly and Dash. Master various chart types, components, and styling techniques for building powerful web applications with Python.

Excel Tips and Tricks
Enhance Excel proficiency with time-saving tips and tricks for data analysis, visualization, and efficient spreadsheet management. Learn essential features to boost productivity.

Excel Tutorial for Beginners
Comprehensive tutorial covering essential Excel skills, from basic functions to advanced features like pivot tables and conditional formatting. Learn to analyze and visualize data effectively.

Pivot Table in Excel
Learn to create, customize, and utilize Pivot Tables in Excel for efficient data summarization and analysis. Master various tools and techniques for powerful data insights.
Conditional Formatting in Excel - Excel Training - Excel Tutorial for Beginners
Learn to enhance Excel data visualization with conditional formatting, including color scales, data bars, and icon sets. Master techniques for highlighting cells based on specific conditions.
Excel Formulas and Functions - Excel Tutorial for Beginners in 2021 - Great Learning
Learn essential Excel formulas and functions for data analysis and visualization. Master basic concepts, explore top functions, and gain practical skills to enhance your spreadsheet proficiency.
Using Excel in Statistics
Learn to leverage Excel for statistical analysis, from data display to hypothesis testing and regression, enhancing your data interpretation skills.

Excel Skills
Enhance data analysis skills with time-series plots, matrix-to-vector conversion, vlookup, histograms, text data import, and correlation techniques in Excel.
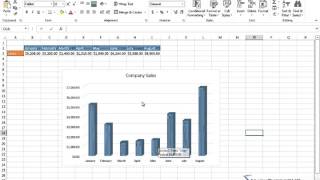
Learn Microsoft Excel
Master Excel essentials to advanced features: data entry, formulas, formatting, charts, pivot tables, and more. Gain practical skills for efficient spreadsheet management and data analysis.

Excel 2016 Tips, Tricks, Shortcuts, Functions & Formulas
Master Excel 2016 with 30 essential tips, tricks, shortcuts, functions, and formulas. Boost productivity and efficiency in data management, analysis, and visualization.

How to Use Formulas and Functions in Microsoft Excel
Learn essential Excel formulas and functions, from basic math to advanced techniques like VLOOKUP and conditional functions, enhancing your data analysis and productivity skills.
Microsoft Excel Tutorial - Beginners Level 1
Comprehensive introduction to Excel basics, covering interface, data entry, formatting, formulas, functions, and charts for beginners to start using the spreadsheet tool effectively.
Text Formulas & Functions in Excel Worksheet and Power Query
Comprehensive tutorial on Excel text functions and Power Query, covering formulas, data extraction, error handling, and data cleaning techniques for efficient spreadsheet management.