
Two Go Programs, Three Different Profiling Techniques
Explore three profiling techniques for Go programs to diagnose and improve performance, including CPU and memory profiling, execution tracing, and understanding Amdahl's Law.

Self-Awareness in C++ Code
Explore techniques for building a memory profiler in C++, focusing on strategies to intercept memory allocations, capture call stacks, and analyze memory usage patterns for optimization and debugging.

Taming Memory Leaks in Node.js - A Deep Dive
Dive into memory leak detection and prevention in Node.js applications, exploring diagnostic tools, common causes, and practical solutions for maintaining optimal application performance.
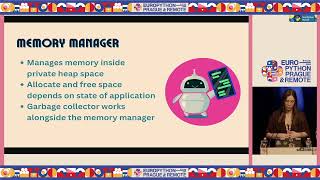
Is It Me or Python Memory Management? - Understanding and Optimizing Memory Usage
Explore Python memory management, analyze usage, and learn optimization techniques for efficient, memory-conscious coding as applications scale and complexity grows.

Analyzing the JavaScript Heap and Detecting Memory Leaks - Conf42 JavaScript 2023
Explore JavaScript memory management, heap analysis, and memory leak detection techniques. Learn to optimize performance and prevent common pitfalls in web applications.

Unlocking LLM Performance with eBPF - Optimizing Training and Inference Pipelines
通过eBPF实现LLM训练和推理过程的可观察性,优化性能。介绍内存、网络和GPU分析方法,分享在PyTorch和llm.c项目中的实践经验,提高GPU利用率。
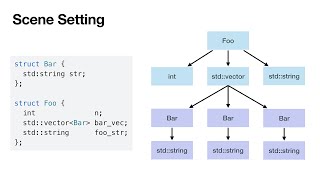
Object Introspection: A C++ Memory Profiler - Lecture
Explore a new open-source Linux technology for precise C++ object memory profiling, enabling efficiency improvements without code modification. Learn two approaches for object introspection with practical examples.
Optimizing LLM Efficiency One Trace at a Time on Kubernetes
Discover how to optimize LLM deployments on Kubernetes using OpenTelemetry's profiling features to identify resource bottlenecks, improve performance, and reduce operational costs through efficient monitoring.

Optimized Resource Allocation for CXL Tiered-Memory Systems
Explore advanced techniques for optimizing CXL tiered-memory systems, focusing on efficient resource allocation, workload profiling, and performance enhancement in data center environments.

Game Performance Optimization for Web, XR and Mobile in Unity 6
Master essential optimization techniques for Unity 6 games across web, XR, and mobile platforms. Learn profiling tools, asset optimization, lighting improvements, and performance monitoring for smooth gameplay experiences.