Dynatrace Diagnostics: CPU, Thread, and Memory Profiling for Developers - Episode 10
Explore Dynatrace diagnostics for developers: CPU, thread, and memory profiling. Hands-on demos guide you through identifying and fixing code hotspots, enhancing application performance.
Memory Profiling Using Code Tagging
Explore advanced techniques for memory profiling in software development, focusing on code tagging methods to optimize performance and resource utilization.

Deep Dive into Android Studio Profilers - Optimizing App Performance
Comprehensive guide to optimizing app performance using Android Studio Profilers, featuring in-depth demos of CPU, memory, and network profiling tools for developers.

Understanding Android Memory Usage
Explore Android memory usage to optimize app performance and user experience on low-memory devices. Learn about different memory types and strategies for efficient memory management.

Kotlin Under the Hood: Understanding the Internals - Google I/O 2019
Explore Kotlin's internals, tools, and features like bytecode, memory profiling, and coroutines to understand how language elements work behind the scenes.
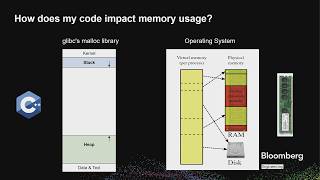
What's Eating My RAM? - Memory Utilization in C++
Explore efficient memory management in C++, learn to identify and resolve memory issues, and discover tools for profiling and analyzing applications to optimize resource usage.
Inspecting and Optimizing Memory Usage in Linux
Explore RAM management in Linux, focusing on allocation across areas and optimization techniques for restricted hardware platforms. Gain insights into kernel and user space memory usage.

DAMON: Implementing Self-Driven Data Access-Aware Efficient Linux System
Explore DAMON, a Linux kernel subsystem for efficient data access monitoring, and DAMO, its user-space tool. Learn about access-aware system operations and self-driving optimizations through live demonstrations.

Python Performance Matters
Explore Python's unique performance challenges and discover Scalene, a cutting-edge profiler offering faster, more accurate, and actionable insights for optimizing CPU, GPU, and memory usage.
Profiling CPU and Memory on Linux, with Opensource Graphical Tools
Learn to profile CPU and memory on Linux using open-source graphical tools like heaptrack and hotspot. Discover efficient ways to identify performance bottlenecks and memory allocation issues in your applications.
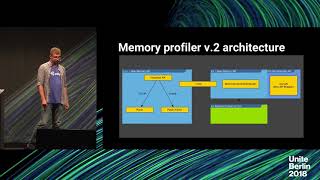
Memory Profiler - The Tool for Troubleshooting Memory-Related Issues
Explore Unity's Memory Profiler for efficient troubleshooting of memory-related issues, including leak detection, allocation analysis, and in-depth memory inspection.
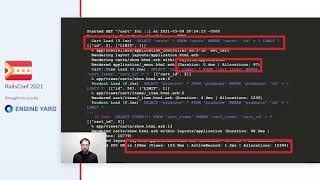
Profiling to Make Your Rails App Faster
Learn to identify and optimize slow code in Rails apps using profiling tools and best practices for improved performance.

Leveraging Prometheus' TSDB for Conprof - Continuous Profiling
Explore conprof, an open-source tool for continuous profiling. Learn how it adapts Prometheus' time-series database for efficient storage and analysis of CPU and memory profiles over time.
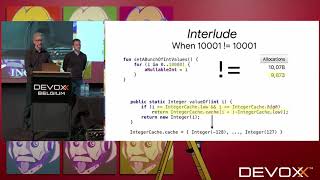
Kotlin Under the Hood
Explore Kotlin's internal workings, modern features, and extensions. Learn to use Android tools for deeper understanding and improved development practices.
Kotlin Under the Covers
Explore Kotlin's hidden mechanisms, including object allocation and reflection, and learn tools to analyze code behavior for better performance and understanding.

GraalVM - Run Programs Faster Anywhere
Explore GraalVM's integrated, polyglot environment for enhanced performance across multiple programming languages. Learn to optimize code execution, debug, and profile applications efficiently.

GraalVM - Run Programs Faster Anywhere
Explore GraalVM's capabilities for enhancing Java ecosystem with integrated, polyglot execution environment. Learn about its support for multiple languages and potential for improved performance and development workflows.

Building Native Modules for React Native
Learn to build native modules for React Native, exploring integration techniques, internal workings, and best practices for seamless app development with native code.
Typegrind - Type Preserving Heap Profiler for C++
Explore a type-preserving heap profiler for C++ that provides detailed memory allocation insights, including exact type information for allocated objects, even with templates and standard containers.
In House to Open Source - Stitching the Past to the Future
Explore the transition from legacy code to open-source solutions, focusing on Python's advantages in software migrations and the implementation of robust frameworks like Apache Airflow.
Where Is the Bottleneck?
Discover tools and techniques to diagnose performance bottlenecks in Python programs, identify resource-intensive areas, and optimize software efficiency.