
R Shiny Web Application
Learn to create interactive web applications using R Shiny, from basics to advanced features like data-driven apps and machine learning integration. Deploy your creations on Heroku.
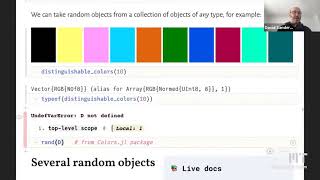
Sampling and Random Variables in Julia - Lecture 9
Explore random sampling, probability distributions, and data visualization techniques using Julia, covering topics from basic coin tosses to complex probability densities and histogram normalization.

Introduction to Statistics in Data Science
Comprehensive introduction to key statistical concepts in data science, covering population, sampling, variables, measurement scales, and data visualization techniques.
Python Seaborn Tutorial in Hindi
हिंदी में Seaborn डेटा विज़ुअलाइज़ेशन लाइब्रेरी का व्यापक परिचय। लाइन प्लॉट, हिस्टोग्राम, बार प्लॉट, स्कैटर प्लॉट, हीटमैप और पेयरप्लॉट जैसे विभिन्न प्रकार के ग्राफ़ बनाना सीखें।

Python for Data Visualization in Hindi - Data Visualization - Python Tutorial
हिंदी में पायथन का उपयोग करके डेटा विज़ुअलाइज़ेशन सीखें। विभिन्न प्रकार के प्लॉट बनाने के लिए मैटप्लॉटलिब और सीबॉर्न लाइब्रेरी का उपयोग करें, जैसे लाइन, बार, स्कैटर, हिस्टोग्राम और बॉक्स प्लॉट।
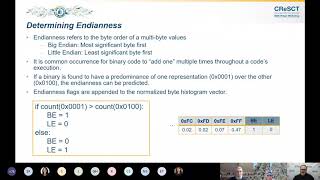
Binary Analysis with Architecture and Code Section Detection Using Supervised Machine Learning
Explore supervised machine learning techniques for binary analysis, focusing on architecture and code section detection to enhance reverse engineering and security analysis.

Embedded Linux Quality Assurance: How to Not Lie with Statistics
Explore statistical quality assurance for embedded Linux systems, covering best practices, automated testing, and data evaluation using R. Learn to avoid common pitfalls in interpreting results.
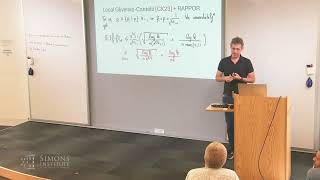
Locally Private Histograms in All Privacy Regimes
Explore frequency estimation in data analysis, focusing on local differential privacy. Learn about algorithms, error bounds, and the intriguing low-privacy regime in histogram computation.
The Google Guide to Exploratory Data Analysis - With Code
Learn to apply Google's Exploratory Data Analysis guide using productivity data, covering data cleaning, visualization, and statistical techniques for insightful analysis and feature selection.
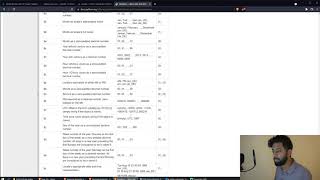
Exploratory Data Analysis
Learn techniques for extracting meaningful insights from new datasets through hands-on exploratory data analysis, covering data import, filtering, visualization, and advanced manipulation methods.
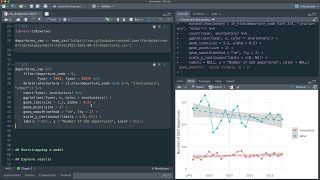
Estimate Change in CEO Departures With Bootstrap Resampling
Explore bootstrap resampling with tidymodels to analyze trends in CEO departures, using generalized linear models and #TidyTuesday data.
Microsoft Excel Ultimate Chart Tutorial - 10 of the Most Useful Chart Types Explained
Learn to create and use 10 essential Excel chart types, from histograms to pie charts, with step-by-step guidance for beginners and intermediate users.
Data Visualization in Python - Altair Data Preparation Techniques
Explore data preparation techniques in Altair for effective visualization, including aggregation, binning, time unit transforms, and filtering to shape and analyze your data effectively.
Business Data Analysis with Excel - Excel for Data Analysis
Learn robust business data analysis using Excel. Explore histograms, running records, and process behavior charts to analyze trends, compare data, and derive insights without programming or advanced statistics.
Statistics with R Programming Language - Step by Step
Learn statistical concepts and their implementation in R programming. Step-by-step tutorials cover introductory to intermediate topics, with hands-on practice using downloadable datasets and scripts for a comprehensive learning experience.
Descriptive Statistics Concept and With R
Learn descriptive statistics techniques and their implementation in R, covering data summarization, visualization, and basic measures to effectively analyze and present research findings.
Graphs and Descriptive Statistics with R - R Statistical Software Tutorial Videos
Learn to create various graphs and calculate descriptive statistics using R. Master bar charts, boxplots, histograms, scatterplots, and more while customizing plots and adding text and legends.
Nutrients by the Numbers - Statistical Analysis of Food and Nutrient Data
Explore statistical analysis of food and nutrient data relationships, visualize distributions through informative plots and histograms with Gay Wilson.
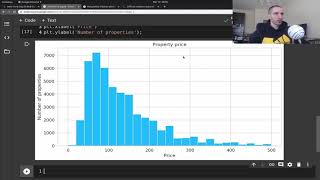
Data Visualization Tutorial for Beginners with Matplotlib in Python - Exploratory Data Analysis
Explore fundamental data visualization techniques using Matplotlib and Seaborn in Python. Learn to create histograms, box plots, violin plots, bar charts, line charts, scatter plots, and more for effective exploratory data analysis.
Prometheus Sparse High-Resolution Histograms in Action
Explore Prometheus sparse high-resolution histograms: instrumentation, ingestion, storage, querying, and visualization. Learn about precise quantile estimations and high-resolution heatmaps with real-world benchmarks.
DoorDash's Journey from StatsD to Prometheus - Scaling to 10 Million Metrics per Second
Explore DoorDash's migration from StatsD to Prometheus, handling 10 million metrics/second. Learn best practices, challenges, and lessons for efficient large-scale metric management.