
Beginner's Crash Course to Elasticsearch and Kibana
Learn Elasticsearch and Kibana basics through short videos covering key concepts, operations, queries, and data visualization techniques for developers new to these powerful tools.

Elasticsearch
Learn to set up and configure ELK stack on GCP, including security, monitoring, and analytics features for comprehensive log management and system insights.

Elastic Search
Learn Elasticsearch fundamentals, installation, architecture, and basic operations using Kibana and Postman. Gain practical skills for creating indexes and documents in this powerful search engine.

ELK Tutorial in Hindi - Elastic Stack Tutorial
In this tutorial, we have covered all the important topics such as, What is ELK Stack, ELK Architecture, Types of Monitoring, and much more that will help you to understand this concept with ease.
[ko-KR] Elastic Observability를 이용한 통합 시스템 모니터링 - UbuCon Asia 2022
MSA 환경에서 Elastic Observability를 활용한 통합 시스템 모니터링 방법과 문제 해결 과정을 Ubuntu 환경에서 시연을 통해 학습합니다.

Elasticsearch Capability - Introduction and Overview
Discover powerful distributed search and analytics with Elasticsearch. Learn to index, analyze, and retrieve data in real-time for diverse applications.

Filebeat for Elasticsearch Log Monitoring and Shipping
Discover how to monitor Elasticsearch logs using Filebeat, collect events, and ship them to a monitoring cluster for real-time visibility in Kibana.
Network Flow Monitoring in Kubernetes with Contiv/VPP CNI and Elastic Stack
Explore powerful network flow monitoring in Kubernetes using Contiv/VPP CNI and Elastic Stack for real-time visibility, debugging, bottleneck identification, and security incident investigation.
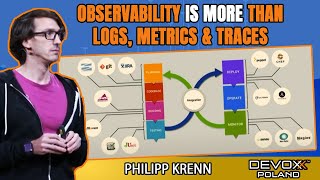
Observability is More than Logs, Metrics and Traces
Explore observability beyond logs, metrics, and traces. Learn holistic system monitoring approaches, creating richer events aligned with business needs, and adding value through comprehensive system understanding.
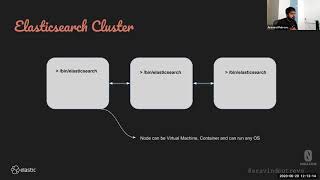
Building a Security Platform with Elastic Stack - Part 1
Learn to build a security platform using Elastic Stack. Explore basic components, data ingestion tools, data management, and cluster security. Gain insights from an experienced developer on leveraging SIEM for effective security monitoring.
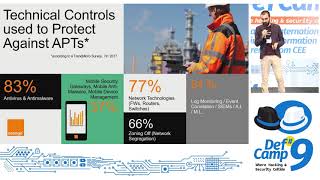
Needles, Haystacks and Algorithms - Using Machine Learning to Detect Complex Threats at DefCamp - 2018
Explore machine learning techniques for detecting complex threats in cybersecurity, focusing on APTs, technical controls, and innovative solutions using algorithms and data analysis.

We're All Searching for Something - An Introduction to Elastic on Microsoft Azure
Explore Elastic Stack's enterprise search, observability, and security solutions on Azure. Learn to leverage search for applications, websites, and Azure environment protection.
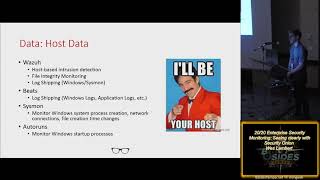
Enterprise Security Monitoring - Seeing Clearly with Security Onion - Wes Lambert
Learn to implement enterprise-level security monitoring using Security Onion, covering tools, data types, interfaces, and deployment strategies for effective threat detection and analysis.
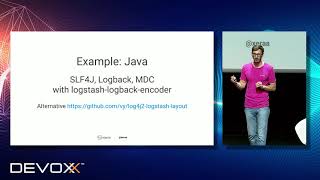
Centralized Logging Patterns
Explore centralized logging patterns for organizations with multiple servers or containers. Learn advantages and disadvantages of various approaches, including parsing, sending, structuring, containerizing, and orchestrating logs.

Live Kubernetes Debugging with the Elastic Stack
Hands-on guide to troubleshooting Kubernetes apps using Elastic Stack, covering health checks, monitoring, tracing, logs, and deployment analysis for efficient problem-solving.

And the Beats Go On
Explore new data shippers for Elasticsearch: Packetbeat for network packets, Metricbeat for machine metrics, and Filebeat for log files. Learn to build custom beats with Libbeat.

Monitor Your Java Applications with the Elastic Stack - Logs, Metrics, Pings, and Traces
Comprehensive guide to monitoring Java applications using Elastic Stack, covering logs, metrics, pings, and traces for effective microservices management and troubleshooting.
Live Kubernetes Debugging with the Elastic Stack
Live Kubernetes debugging session using Elastic Stack, covering health checks, monitoring, tracing, logs, and deployment verification. Demonstrates practical troubleshooting techniques for critical app issues.
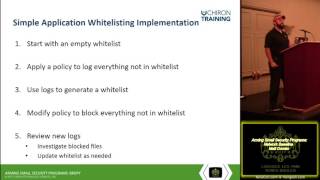
Arming Small Security Programs - Network Baseline - Matt Domko
Learn to establish network baselines for small security programs, covering malware detection, logging, and traffic analysis using tools like Bro and Security Onion.
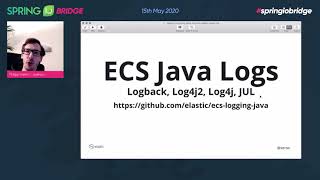
Logging in Spring Boot with the Elastic Stack
Explore efficient logging in Spring Boot using Elastic Stack. Learn to implement, manage, and visualize logs, add tracing, and optimize data collection for production environments.

Monitoring Infrastructure Using the Elastic Stack
Learn to build a robust monitoring infrastructure using Elastic Stack. Explore Beats, Logstash, Elasticsearch, and Kibana for efficient log and metric analysis in IoT and microservices environments.