Introduction to Databricks Delta Live Tables
Accelerate data pipeline development with Databricks Delta Live Tables. Learn setup, ingestion, table creation, pipeline execution, and data validation for faster, more reliable projects.

Query Folding in Power Query: Importance for Performance
Discover query folding's importance for Power Query performance and learn factors that can hinder its effectiveness.

Declarative ETL Pipelines with Delta Live Tables - Modern Software Engineering for Data Analysts and Engineers
Modernize ETL pipelines using Delta Live Tables for efficient data management. Learn development, production, and best practices for reliable, testable, and scalable data processing.
Understanding Stream-Table Duality Using Kafka, Flink SQL and Debezium Format
Explore stream-table duality using Kafka, Flink SQL, and Debezium format. Learn about CDC events, SQL queries on changelog data, and practical applications through a demo.

Once Upon a File - Navigating Data Import and Export Challenges
Explore common file format challenges and solutions in data import/export, covering plain text, CSV, XML, and Excel files. Learn to handle encoding, formatting, and regional setting issues.

ES|QL - Elasticsearch's New Query Language for Java Developers
Explore ES|QL, Elasticsearch's new query language combining SQL and Bash, for improved performance and seamless integration across Java and Kibana.
Statistics with R Programming Language - Step by Step
Learn statistical concepts and their implementation in R programming. Step-by-step tutorials cover introductory to intermediate topics, with hands-on practice using downloadable datasets and scripts for a comprehensive learning experience.
Linear Regression Concept and with R Video Series
Comprehensive video series on linear regression concepts and R implementation, covering simple and multiple regression, assumptions, interactions, and model selection techniques.
Bootstrapping Statistics and Bootstrapping in R
Learn bootstrapping in statistics and R, covering resampling techniques, hypothesis testing, and confidence intervals. Gain practical skills with examples and downloadable datasets.
Analysis of Variance - ANOVA Statistics and ANOVA with R
Learn to perform Analysis of Variance (ANOVA) with practical examples and R implementation. Master statistical techniques for comparing multiple group means, including post-hoc tests and non-parametric alternatives.
Descriptive Statistics Concept and With R
Learn descriptive statistics techniques and their implementation in R, covering data summarization, visualization, and basic measures to effectively analyze and present research findings.
Bivariate Analysis in Statistics and with R - Statistics for Beginners
Comprehensive exploration of bivariate analysis techniques in statistics using R, covering various tests and methods for analyzing relationships between two variables.
Univariate Analysis in Statistics and with R - Statistics for Beginners
Comprehensive introduction to univariate analysis in statistics, covering key concepts like t-distribution, hypothesis testing, and confidence intervals. Includes practical examples using R for data analysis and visualization.

Getting Started with R - R Statistical Software Tutorial Videos
Comprehensive introduction to R programming for beginners, covering installation, basic operations, data handling, and essential functions. Ideal for those starting their journey in data analysis and statistics.
Graphs and Descriptive Statistics with R - R Statistical Software Tutorial Videos
Learn to create various graphs and calculate descriptive statistics using R. Master bar charts, boxplots, histograms, scatterplots, and more while customizing plots and adding text and legends.
Linear Regression in R
Comprehensive guide to linear regression in R: model fitting, assumption checking, interpretation, categorical variables, interactions, and advanced techniques for effective data analysis.
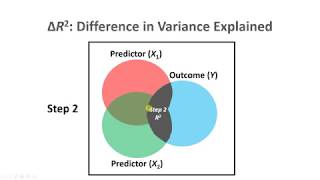
Conceptual Overviews of Statistical and Data-Analytic Tools and Techniques
Explore key statistical and data analysis methods, from hierarchical regression to survival analysis, with conceptual overviews of advanced techniques and tools.
Survival Analysis with TCGA Data in R - Create Kaplan-Meier Curves
Learn survival analysis using TCGA data in R, including Kaplan-Meier curves. Covers key concepts, data preparation, and practical implementation using survival and survminer packages.

Sampling and Probability - Learning Statistics: Concepts and Applications in R
Explore sampling, probability, and statistical tools for extracting key information from data. Learn about data collection, probabilistic reasoning, and practical applications of Bayes' Rule in everyday life.
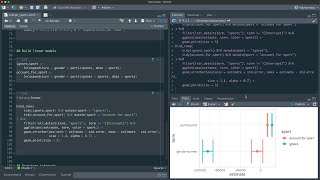
Handling Coefficients for Modeling Collegiate Sports Expenditures
Explore collegiate sports expenditures using linear modeling and tidymodels, focusing on handling coefficients and intervals for insightful analysis of financial patterns.
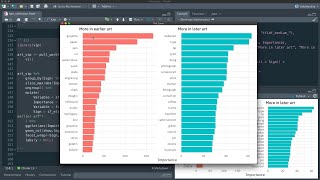
Explore Changes in Art Over Time With Tidymodels
Analyze art trends in the Tate collection using tidymodels for regression modeling, text feature engineering, and model diagnostics to uncover insights on changing art media usage over time.