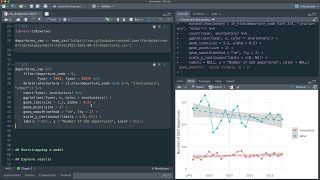
Estimate Change in CEO Departures With Bootstrap Resampling
Explore bootstrap resampling with tidymodels to analyze trends in CEO departures, using generalized linear models and #TidyTuesday data.
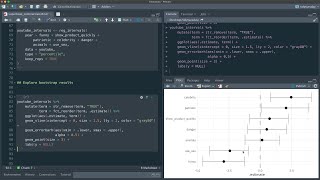
Compute Bootstrap Confidence Intervals for Super Bowl Commercial Characteristics
Explore how Super Bowl commercial characteristics evolve over time using tidymodels for bootstrap confidence intervals and data visualization techniques.
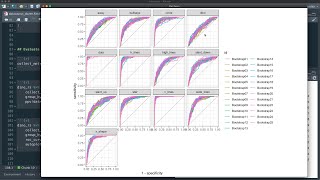
Predict Class Membership for the Datasaurus Dozen With Tidymodels
Explore multiclass evaluation metrics for random forest models using the Datasaurus Dozen dataset, focusing on model performance and visualization techniques.
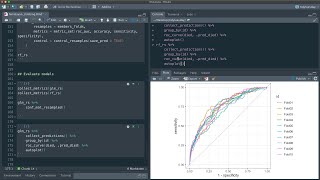
Impute Missing Data and Handle Class Imbalance for Himalayan Climbing Expeditions
Learn to predict survival in Himalayan climbing expeditions using tidymodels in R. Explore data handling, imputation, and modeling techniques for imbalanced datasets.
Cyber & Data - What is Data?
Explore data types, formats, and structures in cybersecurity. Learn parsing, encoding, compression, and file analysis techniques for effective data handling and security.
Introducing Apache Spark 3.0 - A Decade of Progress and Future Outlook
Apache Spark 3.0: Reflecting on a decade of progress and unveiling new features to enhance data processing accessibility, speed, and compatibility across various sources and environments.
Slowly Changing Dimensions Type 2 in Data Lakes - Tech Chat
Explore Slowly Changing Dimensions Type 2 in data lakes using Delta Lake, focusing on market segmentation for a climbing eCommerce site. Learn to track historical and current data effectively.
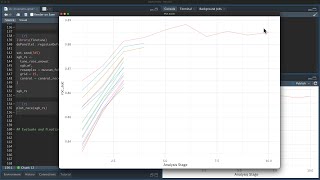
How to Handle High Cardinality Predictors for Data on Museums in the UK
Explore effect and likelihood encodings for high cardinality predictors in tidymodels, using UK museum data to demonstrate practical applications.
Orchestration Made Easy with Databricks Workflows
Discover Databricks Workflows: a managed orchestration service for streamlined data pipelines. Learn to create, run, and monitor reliable workflows, implement recovery actions, and explore new features for efficient data management.
Data Warehousing on the Lakehouse - Unifying Data, AI, and Analytics
Unify data, AI, and analytics with the lakehouse architecture. Learn success stories, use cases, and best practices for ingesting, storing, and governing data at scale for SQL and BI workloads using Databricks SQL.
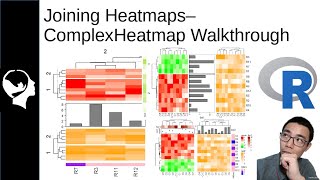
Joining Multiple Heatmaps - ComplexHeatMap Tutorial
Learn to combine multiple heatmaps in R using ComplexHeatmap. Master horizontal and vertical merging, customization, and annotations for effective data visualization in bioinformatics.
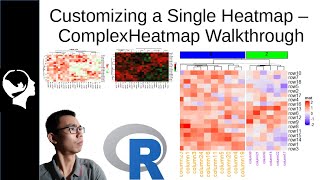
Creating a Heatmap in R - ComplexHeatmap Tutorial Part 1
Learn to create intricate heatmaps in R using ComplexHeatmap package. Master setup, color customization, title modification, and data ordering for effective visualization of multidimensional genomic data.
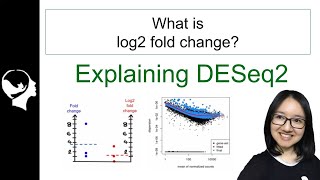
Log2 Fold-Change & DESeq2 Model in a Nutshell
Explore log2 fold-change, DESeq2 model, and differential expression analysis challenges. Learn the theory behind DESeq2 and its practical application in R for bioinformatics research.
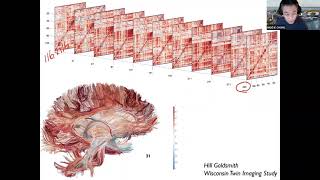
Topological Learning and Its Application to Multimodal Brain Network Integration
Explore topological learning for integrating multimodal brain networks, focusing on a novel framework using persistent homology and Wasserstein distance-based loss for efficient computations in neuroimaging studies.
Graph ggPLOT Beginner Tutorial - Creating Simple Graphs in R
Learn to create simple graphs using ggplot2 in R, enhancing your data visualization skills for effective analysis and presentation.
Creating Simple Graphs in R Studio - Bar, Scatter, and Box Plots
Learn to create bar graphs, scatter plots, pie charts, and box plots using simple R functions for effective data visualization in RStudio.
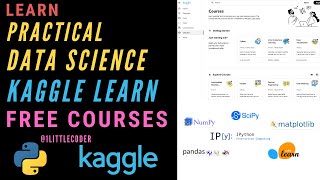
How to Become a Practical Data Scientist with Kaggle Learn
Discover a comprehensive, free path to becoming a practical data scientist using Kaggle Learn's step-by-step courses, covering Python, machine learning, data visualization, and more.

Command-Line Data-Wrangling for Security Professionals
Mastering command-line tools for efficient data manipulation in offensive security. Learn sorting, regex, grep, find, and JSON processing to enhance your hacking capabilities.

Camunda BPM - Connectors, Data, Scripting English
Explore Camunda BPM 7.2's powerful system integration features, including Web Service connectors, XML/JSON handling, scripting languages, and template engines for efficient workflow automation.
Tools and Techniques - Data Science with R - Dr. James Geddes
Explore data science techniques using R with Dr James Geddes. Learn practical skills for analyzing and visualizing data from an expert at the Alan Turing Institute.
Introducing Prestissimo: Presto's Next-Gen Query Execution Engine
Explore Prestissimo, Presto's new C++ query execution engine, offering improved performance, reliability, and efficiency for data analytics and open data lakehouses.