Effective Observability for Cloud Native Applications - Monitoring and Analysis with OpenTelemetry
Delve into cloud-native observability practices, exploring OpenTelemetry and open-source solutions for real-time monitoring, analysis, and cross-platform diagnostics of applications.

В чём польза распределённых трассировок
Узнайте о практических сценариях применения распределённых трассировок, от базовых до продвинутых, включая реальные примеры построения телеметрической инфраструктуры.

Using OpenTelemetry to Troubleshoot and Monitor Production Applications
Explore OpenTelemetry for enhanced visibility in production environments, focusing on monitoring and observability concepts, tools, and Elixir libraries for distributed systems.
Tracing Issues in Your Application
Discover effective techniques for tracing and debugging issues in your applications, enhancing your problem-solving skills and improving software reliability.
Using OpenTelemetry on Kubernetes - DevNation Tech Talk
Explore distributed tracing with OpenTelemetry on Kubernetes for effective troubleshooting and observability in complex cloud-native applications.
Distributed Tracing with Grafana Tempo and OpenTelemetry
Explore distributed tracing using Grafana Tempo and OpenTelemetry for cloud-native apps. Learn to collect RED metrics and traces without code changes for improved observability.
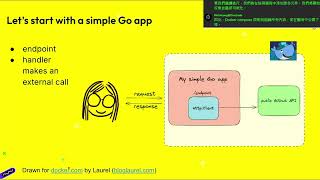
Getting Started with OpenTelemetry: Instrumenting, Collecting, and Visualizing Telemetry Data
Instrument, collect, and visualize telemetry data using OpenTelemetry in Golang applications. Learn strategies for effective implementation and data analysis.

Kiali with Istio: Monitoring and Configuring Services in Service Mesh Architecture
Explore Kiali integration with Istio for monitoring, configuring services, enabling observability, and distributed tracing in service mesh architecture.
Level Up Your Observability with OpenTelemetry
Discover OpenTelemetry's power for enhanced observability. Learn implementation strategies, from automatic to manual instrumentation, and effective rollout techniques for improved system visibility.
OpenTelemetry Amplified - Full Observability with eBPF-Enabled Distributed Tracing
Explore innovative solutions for enhanced system observability using OpenTelemetry and eBPF technology, offering integrated, less invasive approaches for real-time insights into distributed systems.
Navigating the Complexities of Service-to-Service Invocations - Deep Dive Into Causality
Explore tools and techniques for visualizing causality in Spring services, including traces, workflows, and service meshes. Learn to enhance system design and collaboration through causal relationship insights.
Distributed Tracing Made Easy with .NET Core
Explore distributed tracing in .NET Core for end-to-end visibility in complex systems. Learn about new diagnostics capabilities, standards to avoid vendor lock-in, and leveraging OpenTelemetry for flexible tracing solutions.

Practical OpenTelemetry in JavaScript and TypeScript
Master practical OpenTelemetry implementation in Javascript/Typescript, covering instrumentation, observability setup, context management, and integration with messaging systems and Kubernetes.

Using OpenTelemetry for Deep Observability Within Messaging Queues
Discover how to implement deep observability in messaging queues using OpenTelemetry's semantic conventions, with practical insights on monitoring Kafka, RabbitMQ, and Amazon SQS for enhanced system performance.
Distributed Tracing with Jaeger and OpenTelemetry
Master distributed tracing fundamentals through Jaeger and OpenTelemetry, exploring platform features, performance monitoring, and the upcoming Jaeger v2 release with its native OpenTelemetry integration.

The Road to Observability Everywhere - Implementing Trace-Driven Testing with OpenTelemetry
Discover how monday.com leverages OpenTelemetry tracing for end-to-end testing, improving feedback cycles by 50% and reducing test creation time by 90% while ensuring comprehensive system observability.
Lessons Learned Adopting OpenTelemetry at Scale
Discover practical strategies and real-world insights for implementing OpenTelemetry in complex enterprise environments through Heroku's journey, including adoption challenges, technical guidance, and success factors.
Cognitive and Self-Adaptive System for Effective Distributed-Tracing in Applications
Discover how machine learning and cognitive approaches revolutionize distributed tracing, enabling dynamic sampling, enhanced API monitoring, and improved system reliability through automated trace collection and analysis.
Mastering OpenTelemetry Collector Configuration
Master OpenTelemetry Collector configuration through hands-on demonstrations and real-world examples, covering essential setup techniques, best practices, and common challenges for both beginners and experts.
OpenTelemetry Hands-on - Automatic and Manual Instrumentation for Java and Python Applications
Master OpenTelemetry implementation with hands-on exercises in Java and Python applications, covering instrumentation, data collection, and analysis using Jaeger and Prometheus for enhanced observability.
Perfect Match: Correlating Continuous Profiling with Distributed Tracing for Stronger Observability
Discover how continuous profiling and distributed tracing work together in OpenTelemetry to enhance Kubernetes observability, from kernel-level insights to code-level causality and resource optimization.