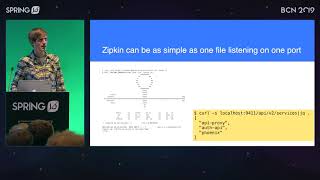
Distributed Tracing in the Wild
Explore distributed tracing's real-world applications, benefits, and implementation strategies across various systems. Learn from actual deployments and connect with the observability community.
Cloud Native Java
Explore microservices architecture, Spring Boot, and Spring Cloud for high-performance organizations. Learn to reduce time-to-production and manage complexity in cloud-native Java applications.
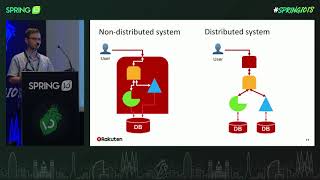
Observability with Spring-Based Distributed Systems
Explore observability in Spring-based distributed systems through logging, metrics, and tracing. Learn to integrate tools like Zipkin, Micrometer, and Spring Cloud Sleuth for enhanced system insights and operational efficiency.
Spring Kafka Beyond the Basics - Lessons Learned on Our Kafka Journey at ING Bank
Explore advanced Spring Kafka concepts, real-world scenarios, and best practices for production-ready applications. Learn to handle exceptions, implement testing strategies, and monitor performance effectively.
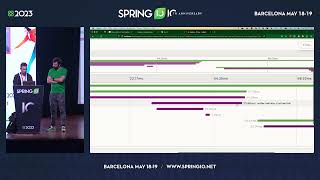
Observability of Your Application
Explore application observability using distributed tracing, metrics, and correlated logs. Learn to troubleshoot issues, analyze performance, and visualize latency with Spring and various observability tools.
Macro Security for Your Microservices
Explore microservices security with Istio, covering traffic encryption, access control, and auditing. Hands-on tutorial on architecture, policy enforcement, and mutual TLS for protecting distributed systems.
Logging, Metrics, and Tracing with Node.js
Explore essential observability tools for Node.js: logging, metrics, and distributed tracing. Learn implementation, visualization, and best practices for effective service monitoring.
CHARLAS - Tracing Distribuido con OpenTelemetry
Explora el tracing distribuido con OpenTelemetry: conceptos, instrumentación automática y demostración práctica para monitorear sistemas distribuidos eficientemente.

It's a Polyglot World of Stateless Functions and Stateful Actors
Explore Dapr, an open-source runtime enabling portable, polyglot serverless applications combining stateless functions and stateful actors with built-in state management and distributed tracing.
Migrating to OpenTelemetry From a Custom Distributed Tracing Pipeline
Discover Shopify's journey migrating to OpenTelemetry, exploring motivations, advantages, and implementation details for improved distributed tracing in cloud-native environments.
Jaeger Deep Dive
Explore Jaeger's architecture, features, and roadmap. Learn about adaptive sampling, multi-tenancy, and deployment strategies for this distributed tracing platform.
From Alert Notification to Comparison of Good and Bad Requests in One Click
Explore efficient troubleshooting by linking metrics, traces, and alerts. Learn to compare problematic and normal traces automatically, reducing time-to-mitigation using open-source tools like Prometheus and Jaeger.
Jaeger Intro
Explore Jaeger's distributed tracing capabilities, architecture, and observability features for cloud-native applications. Learn about sampling techniques and integration with OpenTelemetry.
What Happens When Service Mesh Maintainers Get a Taste of Their Own Mesh
Service mesh creators share experiences running their own product in production, revealing complex bugs, diagnostic challenges, and how it transformed their development approach.
Jaeger Deep Dive
Explore Jaeger's architecture, deployment, sampling techniques, and integration with OpenTelemetry. Learn best practices and roadmap for this distributed tracing platform.
Deep Dive - Jaeger
Explore Jaeger's architecture, adaptive sampling, multi-tenancy, and recent features. Gain insights into the project's roadmap and learn how to contribute to this distributed tracing system.
Jaeger Intro and Deep Dive
Comprehensive introduction to Jaeger distributed tracing, covering installation, basics, and future developments built on OpenTelemetry collector. Explores architecture, features, and deployment strategies.
Traces from Events - A New Way to Visualise Kubernetes Activities
Explore how Kubernetes Events can be transformed into OpenTelemetry Traces for powerful visualization using Jaeger, offering new insights into complex system activities.
Cortex - Intro and Production Tips
Explore Cortex: scalable, multi-tenant time-series data store. Learn project updates, production tips, and comparisons with Thanos for efficient data management and analysis.
eBPF in Microservices Observability
Explore eBPF's role in enhancing microservices observability, addressing challenges like data overload and consistency, and its applications in distributed tracing and context decoration.
Jaeger - Intro and Deep Dive
Explore Jaeger distributed tracing: installation basics, architecture, and future developments. Learn about its integration with OpenTelemetry collector and upcoming features for enhanced tracing capabilities.