
Uncovering Hidden OTel Traces - Leveraging Prometheus in a Standardized Manner
Explore advanced techniques for leveraging Prometheus with OpenTelemetry, enhancing observability and uncovering hidden traces in cloud-native environments.
OpenTelemetry and Epsagon - A Journey in Observability
Explore Epsagon's journey with OpenTelemetry, from adoption challenges to becoming part of the community. Learn valuable insights on leveraging open-source projects for observability and avoiding common pitfalls.
Adding OpenTelemetry to Production Apps - Lessons Learned
Discover practical insights and best practices for integrating OpenTelemetry into production applications, enhancing observability and performance monitoring.
Implementing Observability for Microservice Applications on Kubernetes
Learn to implement observability in Kubernetes microservices using Open Telemetry, exploring tracing libraries, distributed systems, and deployment patterns for enhanced application monitoring.
The Evolution of Tracing Containerized Environments
Explore the evolution of tracing in containerized environments and learn practical tools for implementing observability in distributed systems.
Correlating Signals in OpenTelemetry - Benefits, Stories, and Future Developments
Explore OpenTelemetry's advanced capabilities for correlating traces, metrics, and logs, enabling seamless investigations across services and infrastructure. Learn from real-world examples and future developments.

Overcoming Challenges Implementing OpenTelemetry in Decoupled Event-Driven Architecture
Explore strategies for implementing OpenTelemetry in decoupled event-driven architectures, addressing common challenges and optimizing observability in complex distributed systems.
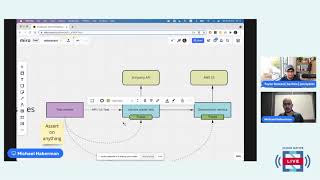
Trace-Based Testing with OpenTelemetry - Cloud Native Live
Explore trace-based testing using OpenTelemetry, covering integration tests, instrumentation, and best practices for cloud-native applications.

Cloud Native Classroom - Open Telemetry
Explore Open Telemetry in cloud-native environments, covering distributed tracing, spans, attributes, and metrics for effective system monitoring and performance analysis.
Building 12 Factor Streaming Data Apps on Kubernetes
Learn to build secure, resilient Kafka streaming apps on Kubernetes using 12-factor principles. Explore Lenses.io's SQL Engine and overcome deployment challenges for portable, cloud-native applications.
CNCF Webinar - The What's and Why's of Tracing
Explore distributed tracing, its importance in microservices, and OpenTelemetry's role in enhancing observability and debugging in cloud-native environments.
xprobes: Hybrid User/Kernel eBPF Probes for Cross-Layer Observability
Explore xprobes, a hybrid eBPF technology combining uprobes and kprobes for enhanced performance diagnostics. Learn how xprobes provide cross-layer visibility, enabling precise attribution of latency to specific functions and system events.
E2E Observability for Connected Vehicle Services Including 5G Cellular Network - Lecture
Explore end-to-end observability for connected vehicle services, focusing on 5G cellular network troubleshooting using distributed tracing technology. Learn about architecture, challenges, and practical solutions.
Distributed Tracing Integration with OpenTelemetry and Knative
Explore distributed tracing integration using OpenTelemetry for serverless functions. Learn to collect and visualize telemetry data, deploy reactive serverless functions, and verify data with OpenTelemetry and Jaeger operators.
Out-of-the-Box Observability and Tracing in Kubernetes with Kong, Zipkin and Prometheus
Learn to collect and visualize observability metrics in Kubernetes using Kong, Zipkin, and Prometheus for improved service reliability and performance monitoring.
Deep Dive: Jaeger - Distributed Tracing and Advanced Features
Explore Jaeger's advanced features for distributed tracing, including adaptive sampling, multi-tenancy, and analytics. Learn about integrations and real-world problem-solving through demos.
Achieving End-to-End Visibility into Complex Event-Sourcing Transactions Using Distributed Tracing
Explore distributed tracing techniques for enhanced visibility in complex event-sourcing transactions, improving system monitoring and performance optimization.
OpenTracing: Beyond Distributed Tracing - Video 2
Explore OpenTracing's role in microservices monitoring, its connection to logging and metrics, and its practical applications through a demo involving distributed traces and Prometheus monitoring.
Introducing the Latest Kubernetes Troubleshooting Features
Explore latest Kubernetes troubleshooting features: Structured Logging, Contextual Logging, and Distributed Tracing. Learn implementation, benefits, and future developments for improved system management.
Distributed Tracing Integration with OpenTelemetry and Knative
Learn to integrate distributed tracing with OpenTelemetry for serverless functions, collect telemetry data, and visualize metrics using Jaeger. Includes live demo and step-by-step instructions for implementation.
Effective Observability with OpenTelemetry
Learn to modernize applications with effective observability using Open Telemetry. Explore key concepts, pillars, and practical implementation through demonstrations and expert insights.