
Weaving Fairytales with Data
Discover the art of data storytelling with three key takeaways: first principles thinking, talking headers, and fairytale magic. Learn to craft memorable narratives that bring data to life.
Data Storytelling for Effective Business and Data Communication
Discover how to transform complex data into compelling narratives, enhancing business communication and decision-making through effective data storytelling techniques.
Best Practices for Creating Stunning R Visuals in Power BI
Learn to create stunning data visualizations in Power BI using R programming, enhancing your data storytelling capabilities with the grammar of graphics concept and best practices for R visuals.
Digital Storytelling with Power BI
Learn to leverage Power BI's features for effective data storytelling, guiding users to better understand their information through visualization and narrative techniques.
Data Storytelling 101
Learn effective data storytelling techniques to create impactful visual narratives, focusing on key elements like goal-setting, snapshots, and actionable insights for compelling business intelligence presentations.
Data Storytelling with Power BI
Discover effective techniques for transforming Power BI reports into compelling digital narratives, leveraging storytelling capabilities to create impactful data presentations.
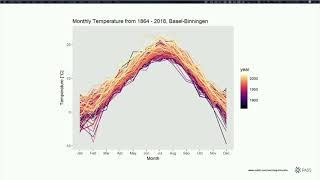
Two Truths That's A Lie - Data Visualization Ethics
Explore data visualization ethics, examining how color and chart choices influence storytelling. Learn to create truthful, impactful visualizations while protecting your company's reputation.

What's in a Name? Data Stories that Would Make the Bard Proud
Learn to transform U.S. Census Bureau data on children's names into captivating stories. Discover techniques for identifying key data points, creating effective visualizations, and crafting compelling narratives to engage any audience.

An Introduction to Data Visualizations and Design Best Practices
Learn effective data visualization techniques, including chart selection, color theory, and design principles to enhance your data storytelling skills and create impactful Power BI reports.

An Introduction to Data Visualizations and Design Best Practices
Learn effective data visualization techniques, including chart selection, color theory, and design principles to enhance your data storytelling skills and create impactful Power BI reports.
Lightning Talks
Explore data storytelling, non-relational database design, Blockchain-AI correlation, and open-source software trust in four concise lightning talks by industry experts.
Why a Good Data Scientist is a Package of Professions - Beyond Technical Skills
Discover how data scientists can evolve beyond technical roles by mastering storytelling, communication, and cross-functional skills to effectively collaborate with product managers and drive business impact.

Visual Design - Creating Clean and Aesthetic Data Visualizations
Master the art of creating clean, aesthetic data visualizations through proven best practices and BI tool features to transform complex data into compelling stories that drive innovative business decisions.
Data Storytelling in the Era of Generative AI - Using LLMs for Interactive Consumer Research
Explore how LLMs revolutionize consumer research by transforming static data into interactive, evidence-based synthetic personas that provide dynamic, real-time insights for marketers.

Visual Design - Do Not Let Data Be Your Cul-de-sac
Learn best practices for creating clean, aesthetic data visualizations to aid business understanding, tell compelling stories, and drive sustainable decisions.

Visual Data Storytelling with Blender and Python
Discover how to create immersive 3D animations for data storytelling by combining Blender's 3D capabilities with Python's 2D plotting libraries, enhancing your data visualization skills.
Data Storytelling and Visualization
Learn effective techniques for communicating data-driven concepts through storytelling and visualization, applicable to both expert and non-expert audiences.
Key Practices to Improve Your Data Communication
Master effective data presentation techniques and learn to create visually appealing documents, slides, and charts that enhance communication of insights while avoiding information overload.
The Art of Data Storytelling Powered by Oracle Analytics
Explore data storytelling techniques using Oracle Analytics to create impactful narratives that influence decision-making and drive insights from complex information.
7 Steps to Creating a Visually Perfect Dashboard Every Time
Master the art of creating impactful dashboards. Learn a 7-step framework to design visually appealing, audience-focused data visualizations that effectively communicate insights and drive business decisions.
Bridging Metrics with Humanity: Empowering Teams and Engaging Clients through Data Visualization
Explore data democratization strategies and storytelling techniques to empower teams and engage clients through effective data visualization, driving innovation and business impact.