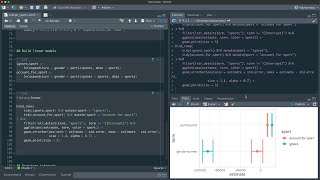
Handling Coefficients for Modeling Collegiate Sports Expenditures
Explore collegiate sports expenditures using linear modeling and tidymodels, focusing on handling coefficients and intervals for insightful analysis of financial patterns.
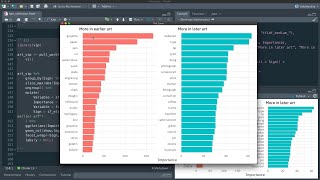
Explore Changes in Art Over Time With Tidymodels
Analyze art trends in the Tate collection using tidymodels for regression modeling, text feature engineering, and model diagnostics to uncover insights on changing art media usage over time.
Kernel Methods for Causal Inference
Explore kernel ridge regression for causal inference, covering dose responses, treatment effects, and extensions to various settings. Learn about consistency, efficiency, and robustness in estimation.
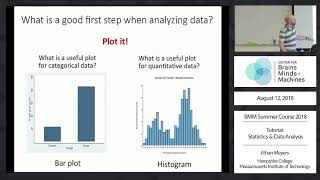
Statistics and Data Analysis
Learn essential statistics and data analysis concepts, including distributions, visualization techniques, correlation, regression, and hypothesis testing, to enhance your data interpretation skills.
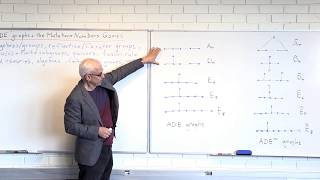
The Ubiquity of ADE Graphs, and the Mutation and Numbers Games - Math Seminars
Explore ADE graphs' mathematical significance, mutation games, and connections to advanced fields like Lie algebra, root systems, and physics in this insightful seminar on combinatorial structures.

Newcomb's Paradox - Famous Math Problems
Explore Newcomb's paradox, a mathematical-philosophical puzzle involving free will, determinism, and rationality. Learn about expected value and strategies for decision-making in uncertain scenarios.

Self-Study Computational Neuroscience - Coding, Textbooks, Math
Comprehensive guide to starting computational neuroscience: programming languages, coding practice, textbooks, math resources, project ideas, and datasets for self-study and skill development.
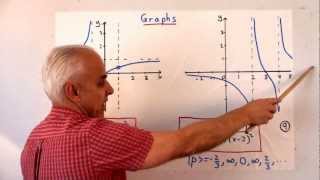
Limits and Rational Poly On-Sequences - Real Numbers + Limits Math Foundations | N J Wildberger
Explore rational polynumbers, infinite sequences, and the concept of infinity in mathematics. Learn about factorizations, limiting behaviors, and the delicate nature of associating sequences with rational functions.
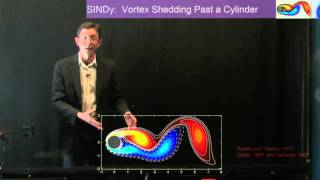
Sparse Identification of Nonlinear Dynamics - SINDy
Explore a novel algorithm combining machine learning and sparse regression to identify nonlinear differential equations from measurement data, with applications in dynamical systems.

Graph Theory and Algorithms
Explore graph theory fundamentals, Kcut algorithms, and weighted min cut problems in this comprehensive overview of advanced algorithmic concepts.
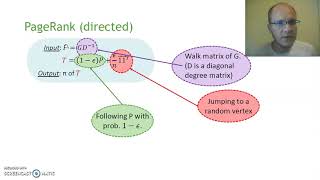
Walking Randomly, Massively, and Efficiently
Explore efficient random walk algorithms for massive graphs, focusing on PageRank implementation and optimization techniques for undirected edges and degree-based calculations.
Statistics Tutorial with Python - Fundamentals and Data Analysis
Learn Python-based statistics: data types, visualization, measures of central tendency, dispersion, and relationships between variables. Gain practical skills for data analysis.
Statistics Tutorial - T Distribution and Hypothesis Testing
Learn to calculate and interpret T distributions, use T tables, understand degrees of freedom, and perform hypothesis testing with independent and dependent samples in this comprehensive statistics tutorial.
Statistics Tutorial 4: Z Scores and Confidence Intervals
Explore probability, normal distributions, sample error, Central Limit Theorem, Z scores, and confidence intervals with Python code examples for practical application.
Statistics Tutorial - Standard Deviation and Coefficient Variation
Learn to calculate standard deviation and coefficient variation using Python, with real-world examples and in-depth explanations of statistical concepts.
Statistics Tutorial - Real World Example with Python
Explore real-world data analysis using Python to maximize profits for a computer company. Learn to parse data, create functions, and gain insights for targeted marketing and product strategies.
Basic Statistics Examples
Learn basic statistics through practical examples with Michael Penn in less than an hour. Randolph College Math and Science.

Uncertainty Quantification of Quantum Chemical Methods - IPAM at UCLA
Explore uncertainty quantification in quantum chemistry, covering error estimation, benchmarking, and machine learning approaches for improved accuracy in computational methods.
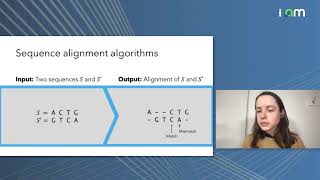
How Much Data Is Sufficient to Learn High-Performing Algorithms?
Explore data-driven algorithm design's impact on performance, focusing on generalization guarantees for combinatorial algorithms with piecewise-structured parameter functions.

Optimal Learning from Data
Explore optimal learning from data, including error recovery, discrete optimization, and handling noisy measurements. Insights on deep learning and stochastic settings provided.
Regression Analysis in Machine Learning - Linear Regression - Logistic Regression
Comprehensive exploration of regression analysis, covering linear and logistic techniques. Learn to leverage data relationships for informed decision-making in various business contexts.