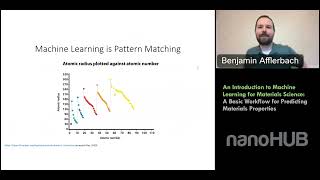
Introduction to a Basic Machine Learning Workflow for Predicting Materials Properties
Learn a basic machine learning workflow for predicting material properties, covering data cleaning, feature engineering, model training, and optimization using decision trees to forecast material bandgaps from compositions.
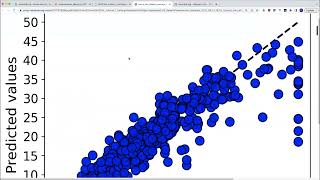
The Materials Simulation Toolkit for Machine Learning (MAST-ML): Automating Development and Evaluation of Machine Learning Models for Materials Property Prediction
Automate machine learning model development for materials property prediction using MAST-ML. Learn data import, feature engineering, model evaluation, and uncertainty quantification through hands-on activities.
How to Clean Data in Excel
Learn essential techniques for cleaning and managing large datasets in Excel, including removing duplicates, identifying attributes, and ensuring data quality for efficient processing.

Become a Power Query Master in Excel in Less Than One Hour
Master Power Query in Excel: Learn to gather, clean, and transform data efficiently. Streamline your workflow, automate tasks, and optimize data preparation for analysis.

Filter Variables with Python - Python Part 15
Learn to filter variables in Python, covering names, ages, phone numbers, and email addresses. Understand the importance of filtering and explore alternatives like RegEx.

How to Create Impactful Dashboards in Excel for Business Analytics
Learn to create dynamic Excel dashboards using pivot tables, charts, and advanced features. Master data cleaning, visualization, and analysis techniques for impactful business insights.
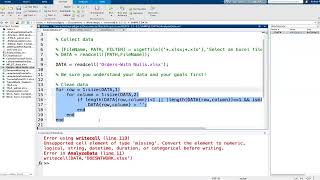
Data Cleaning with MATLAB - nanoHUB Tech Talk
Learn essential techniques for data cleaning in MATLAB, including handling missing values, removing outliers, and formatting data for analysis. Enhance your research and data processing skills.
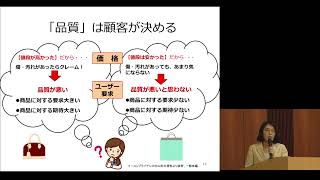
臨床研究者のための生物統計学 - データマネジメントとは
Master データマネジメントの基礎から実践まで、臨床研究における品質管理、データ収集、クリーニング、固定までの包括的なプロセスを学び、効果的な研究データの取り扱いを習得。

Introduction to Data Exploration Using Microsoft Excel
Explore data using Excel: Learn importing, cleaning, basic functions, and statistical analyses for valuable insights from a Mars Petcare Data Engineer.

Football Data Analytics: Azure End-to-End Data Engineering Project
Extract, clean, and analyze football data using Apache Airflow, Azure services, and Tableau. Build a comprehensive data pipeline from Wikipedia to interactive visualizations.
Predicting Healthcare Insurance Costs with Python - Real-World Data Science Problem Solving
Predict healthcare insurance costs using Python and machine learning. Clean data, visualize with pandas, and apply scikit-learn for linear regression in this hands-on tutorial with real-world data analysis.
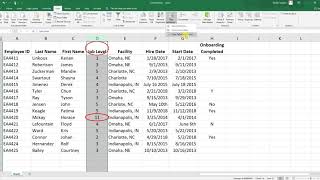
Excel Tutorials
Learn essential Excel techniques for HR data analysis, including data cleaning, statistical tests, and data visualization for effective decision-making.
Cleaning Data and Building Reporting Dashboards in Excel - From Power Query to Interactive Visualizations
Master data cleaning and visualization in Excel through Power Query, PivotTables, and interactive dashboard creation. Transform raw data into meaningful insights while automating your workflow.
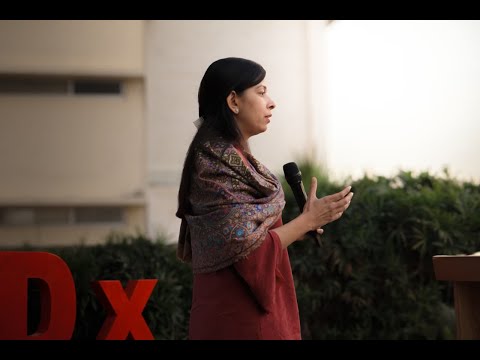
Giving Language a Voice Through AI | Sana Shams | TEDxSICAS DHA Youth
Mrs. Sana Shams explores how artificial intelligence can support language diversity and digital inclusion. Drawing from her own experiences, she discusses building speech-based chatbots for citizen services and regional collaborations that made computing accessible in 11 local languages. Her talk hi