
20 Essential Excel Formulas and Functions Tutorial - 2024 Edition
Master 20 essential Excel formulas and functions, from basic math to advanced lookups and logical operations. Enhance data analysis skills with practical examples and hands-on learning.
Tableau Business Intelligence - Full Course Tutorial
Comprehensive Tableau tutorial covering diverse business scenarios, from personal finance to global data analysis. Learn to create interactive dashboards and gain practical BI skills through hands-on projects.
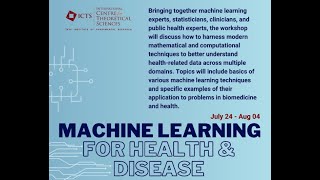
Modeling Noisy Count Data I by Sayan Mukherjee
Explore statistical modeling techniques for analyzing noisy count data, focusing on methods to handle variability and uncertainty in numerical datasets.

Google Sheets Beginner Tutorial - 2023 Update
Master Google Sheets essentials: navigation, formulas, formatting, data management, and collaboration. Gain practical skills for efficient spreadsheet creation and analysis in this comprehensive beginner-friendly tutorial.
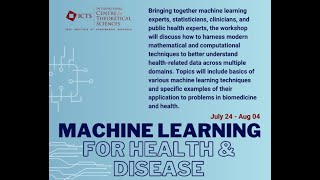
Digital Health Data Governance by Nicki Tiffin
Explore digital health data governance principles, challenges, and best practices for ethical and secure management of healthcare information in the digital age.
Tableau Data Visualization Beginner Tutorial
Learn to connect data sources, create various charts, and master essential Tableau features for powerful data visualization and analysis.
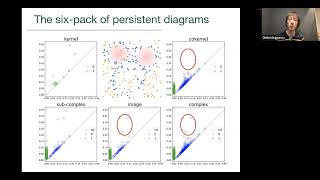
TDA for Chromatic Point Clouds
Generalizace persistentní homologie pro barevné bodové mraky. Detekce prostorových interakcí mezi různými typy bodů s aplikacemi v biologii a medicíně.
Metrics All the Way - Data Driven Operations
Explore data-driven operations and their impact on enhancing organizational efficiency, decision-making, and performance through comprehensive metrics analysis.
Uncovering Community and Project Insights Through Data-Driven Methods
Explore data-driven techniques to gain valuable insights into open source communities and projects, enhancing understanding and decision-making processes.
Building and Supporting Open Source Communities Through Metrics
Explore strategies for leveraging metrics to build and support thriving open source communities, addressing challenges and maximizing data utility for organizational success.

Excel for Finance and Accounting - Full Course Tutorial
Comprehensive Excel tutorial for finance professionals, covering functions, charts, and real-world applications. Learn to create financial statements, analyze data, and improve workflow efficiency.

Apache Log Visualization with Elasticsearch and ELK Stack
Learn to visualize Apache logs using Elasticsearch and ELK Stack on Ubuntu. Set up Elastic Stack, configure components, and create visualizations for effective log analysis and monitoring.
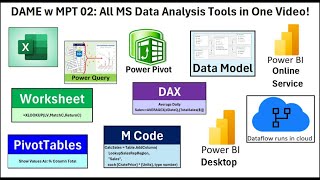
Microsoft Data Analysis Tools: Excel, Power Query, Power BI, Dataflow, DAX, and M Code
Comprehensive tutorial on Microsoft data analysis tools, covering Excel, Power Query, Power BI, and more. Learn to import, transform, and visualize data using various techniques and formulas.

Staring into the Abyss and Eating Glass - From Academia to Startup
Explore the journey from academia to entrepreneurship with insights on building a sports analytics startup. Gain valuable perspectives on challenges, similarities, and differences between academic and business worlds.
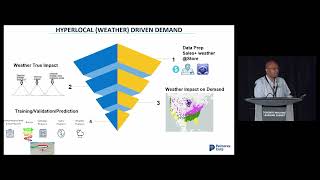
AI at Scale to Understand Impact of Weather on Businesses
Explore how AI scales to analyze weather's impact on business, leveraging historical data to predict demand and inform decision-making across industries.
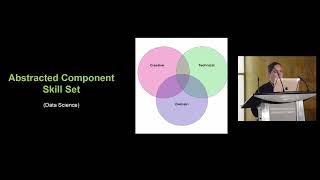
Data Storytelling for Beginners
Explore effective data storytelling techniques, blending math, science, art, and communication, with real-world examples from Shopify's practices.

The Risks of Excluding the Disengaged From Your Dataset
Explore the importance of inclusive datasets in machine learning for accurate predictions and reliable insights across various domains.

My Story as a Data Visualization Freelancer - Ups, Downs, and Lessons Learned
Discover the journey of a data visualization freelancer, exploring challenges, motivations, and valuable insights for success in the field.
Power Query in 20 Minutes - How it Works
Explore Power Query's internals and gain a deeper understanding of this increasingly prevalent tool in Power BI and Fabric technologies.

How to Get Noticed for a Power BI Job Interview
Stand out in Power BI job interviews with a simple yet effective trick to showcase your report creation skills, even without extensive experience.
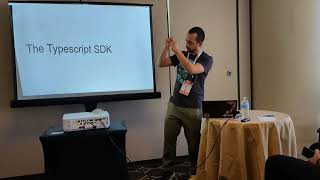
Batch and Stream Analysis with TypeScript Using Apache Beam
Explore batch and stream analysis using Beam's Typescript SDK. Learn API choices, usability, and functionality through demos. Discover how to leverage Typescript for efficient data processing workflows.