
Data Sketches: A Year of Exotic Data Visualizations
Explore a year-long data visualization journey, uncovering insights on creative processes, overcoming challenges, and transforming ideas into compelling visual stories.
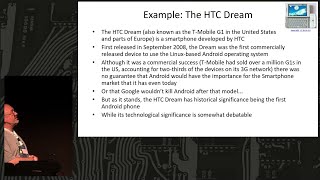
How to Spot Future Retro Classics in Electronics Collecting
Explore strategies for identifying potential future retro classics in electronics, analyzing price trends and factors that transform today's devices into tomorrow's coveted rarities.
The Tommy's Pathway - Providing Effective and Equitable Maternity Care by Basky Tilaganathan
Explore effective and equitable maternity care strategies through the Tommy's Pathway, focusing on improving outcomes and addressing disparities in maternal healthcare.
The Dynamic Mode Decomposition - A Data-Driven Algorithm for Complex Systems Analysis
Explore the Dynamic Mode Decomposition algorithm for analyzing complex systems, including its theory, applications, and implementation using PyDMD package in Python.
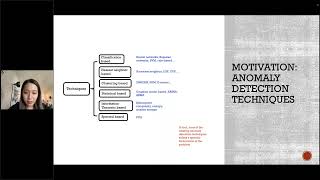
Semi-Supervised Anomaly Detection System Through Ensemble Stacking Algorithm
Explore semi-supervised anomaly detection in retail using ensemble stacking. Learn innovative techniques for fraud prevention, combining deep and traditional models to identify unknown anomalies and enhance fraud detection.

Excel 365 for Beginners: Learn the Basics to Boost Your Spreadsheet Skills
Comprehensive guide to Excel 365 basics: interface navigation, data entry, formulas, formatting, tables, and more. Boost productivity with practical exercises and essential spreadsheet skills.

Building a Simple Recommender System Using Popularity - Non-Personalized Approach
Learn to build a basic recommender system using popularity metrics on the MovieLens dataset. Explore techniques like vote count, mean rating, and damped mean to create non-personalized recommendations.

Tableau Business Intelligence - Beginner Tutorial for Dashboard Creation
Learn to create insightful Tableau dashboards with interactive visualizations, custom reports, and data analysis techniques for real-world business scenarios and effective decision-making.

Excel Ninja Skills - 10 Essential Tips and Tricks for Beginners
Learn essential Excel skills including Venn diagrams, funnel charts, cell counting, find and replace, merging cells, formula conversion, random lists, cell styles, and page numbering in this comprehensive tutorial.
Tableau Business Intelligence - Intermediate Techniques and Dashboard Design
Elevate your Tableau skills with advanced techniques for creating insightful dashboards. Learn to analyze data, visualize trends, and apply cluster analysis to real-world business scenarios.
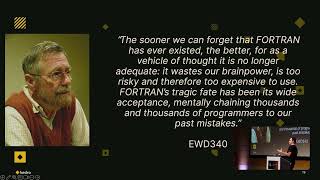
Data Science in Production - Crossing the Chasm
Explore the challenges of integrating data science tools like notebooks into production environments, drawing parallels with spreadsheets and proposing solutions to bridge the gap between experimentation and structured systems.

LLMs in Data Analytics: Can They Match Human Precision?
Explore LLMs in data analytics with Gerard Kostin. Learn about DataGPT's tech stack, LLM capabilities, challenges, and integration with advanced algorithms for efficient data processing and interpretation.
Tumor Phylogeny Inference from Single-cell Datasets - Lecture 2
Explore tumor evolution through single-cell data analysis. Learn advanced techniques for inferring phylogenetic relationships and understanding cancer progression at the cellular level.

Using Data Science to Better Evaluate American Football Players
Explore how data science revolutionizes American football player evaluation, integrating advanced analytics, machine learning, and player tracking data to enhance strategies and redefine the sport's future.
Under the Hood - Hyperlocal Surveillance on Nextdoor
Explores community surveillance on Nextdoor, revealing how gentrification impacts hyperlocal social media posts and potentially exacerbates social tensions and exclusion in neighborhoods.
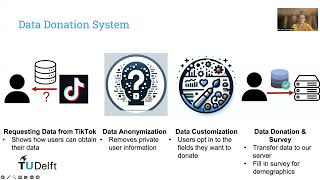
Analyzing User Engagement with TikTok's Short Format Video Recommendations
Explore user engagement on TikTok through data donations, revealing insights on daily usage, attention span, and video preferences in short-format content recommendations.

Excel Pivot Tables Tutorial - From Basics to Advanced Techniques
Master Excel Pivot Tables: Analyze complex data, create insightful charts, and leverage advanced features like Power Pivot and DAX expressions for powerful data manipulation and visualization.
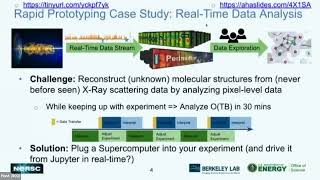
Data Science with Julia - Hands-on Tutorial
Hands-on tutorial exploring Julia for data science, covering interactive analysis, visualization, and machine learning algorithms. Equips participants to apply Julia in their own projects.
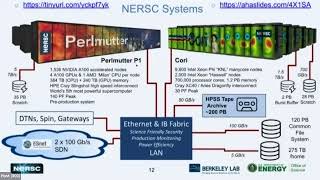
Julia for Python Programmers
Hands-on introduction to Julia for scientific computing and data science, focusing on its efficiency and interactive capabilities for technical applications and scalable computing.

Excel Copilot Tutorial - Boosting Productivity with Microsoft's AI Assistant
Learn to leverage Microsoft Copilot in Excel for data analysis, visualization, and task automation. Boost productivity with AI-powered insights, formulas, and problem-solving capabilities.
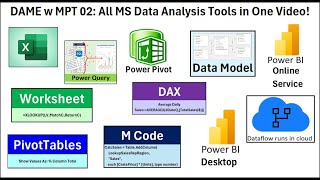
Microsoft Data Analysis Tools: Excel, Power Query, Power BI, Dataflow, DAX and M Code
Comprehensive tutorial on Microsoft data analysis tools, covering Excel, Power Query, Power BI, and more. Learn formulas, data modeling, and visualization techniques for effective data analysis.