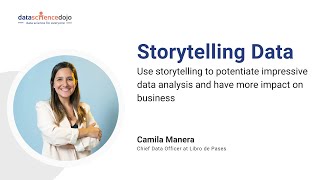
The Power of Effective Data Storytelling - Basics for Data Analysis
Learn effective data storytelling techniques to enhance data analysis impact. Discover how to use visualizations, narratives, and creative approaches to make insights more relatable and actionable for businesses.

Effective Data Storytelling - What Does Your Data Tell You - Storytelling with Data
Learn effective data storytelling techniques to transform raw information into compelling narratives. Discover how to analyze, visualize, and communicate insights for evidence-informed decision-making in organizations.
Time Series Analysis with the KNIME Analytics Platform - Preprocessing, Alignment, Imputation
Learn time series analysis using KNIME: preprocessing, alignment, imputation, forecasting, and evaluation. Build a demand prediction application with (S)ARIMA and machine learning models through hands-on, codeless examples.
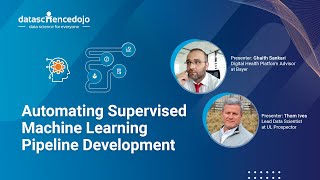
Automating Supervised Machine Learning Pipeline Development
Explore methodologies for automating supervised machine learning pipelines, covering data cleaning, feature engineering, and model development. Gain insights from experienced data scientists on best practices and techniques.
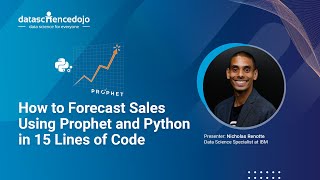
How to Forecast Sales Using Prophet and Python
Learn to build accurate sales forecasts using Prophet and Python in just 15 lines of code. Discover how to leverage this powerful tool for various time series predictions, from market trends to weather forecasting.

Miles to Go Before I Sleep - Gamification, Health Wearables, and Activity
Exploring the impact of gamification and leaderboards on physical activity using Fitbit data. Reveals surprising benefits for sedentary users and potential drawbacks for highly active individuals.
Ace the SQL and Data Science Interview - Complete Interview Prep - SQL Interview Tips and Tricks
Expert insights on acing data science and SQL interviews, covering technical questions, case studies, and strategies to stand out in the competitive job market.
Time Series Analysis for Beginner Data Scientists - Time Series Forecasting
Learn time series analysis for data science: navigate, analyze, and model time series data, create forecasts, and build interactive dashboards. Ideal for beginners with basic coding skills.
Data Manipulation with Dplyr
Learn efficient data manipulation using dplyr in R. Master essential functions for filtering, aggregating, and joining datasets, enhancing your data analysis skills with practical examples.

TF-IDF - Introduction to Text Analytics with R
Explore TF-IDF for text analytics in R: improve document representation, handle unequal lengths and common terms, implement TF-IDF, and clean data matrices post-weighting.
Business Data Analysis with Excel - Excel for Data Analysis
Learn robust business data analysis using Excel. Explore histograms, running records, and process behavior charts to analyze trends, compare data, and derive insights without programming or advanced statistics.
Data Preprocessing in Python
Learn to transform raw text into structured lists and CSVs using Python, enhancing data organization and analysis skills for practical applications.
Step-by-Step Machine Learning Project Implementation: EDA, Feature Engineering, Selection, and Model Training
Comprehensive guide to implementing a machine learning project, covering data cleaning, EDA, feature engineering, selection, model training, and hyperparameter tuning.

OnlyOffice - A Free, Self-Hosted, Open Source Office Suite That Can Replace Microsoft Office Easily
Explore a comprehensive, open-source alternative to Microsoft Office with project management, CRM, and collaboration tools. Learn installation, server setup, and desktop usage.
Microsoft Excel Mastery Unleashed: Exclusive Training from Simon Sez IT
Comprehensive Excel tutorial covering advanced functions, data analysis, and visualization techniques. Ideal for beginners and intermediate users seeking to enhance productivity and data manipulation skills.
Tableau Data Visualization Full Course Tutorial
Comprehensive Tableau tutorial covering data visualization techniques, from basic charts to advanced dashboards. Learn to connect data, create various chart types, customize visuals, and share impactful results.
Observability for User Happiness - Enhancing Web Performance
Explore how observability enhances web performance, user happiness, and product design. Learn practical techniques for instrumenting web apps and leveraging data to optimize user experiences.

The True Value of Statistics in Sports
Explore the true value and competitive edge of statistics in sports with insights from industry experts at Web Summit's Sports Stage.

The Complexities and Paradoxes of Big Data for Social Good
Exploring the complexities and paradoxes of using big data for social good, featuring insights from industry experts on policy, information management, and social impact.

Head vs Heart - Do Statistics Matter in Signing Players?
Explore the role of statistics vs. intuition in player recruitment with sports industry experts, discussing data-driven decision-making in professional athletics.

Statistics in Sport: A Conversation with Bill James and Simon Kuper
Pioneering statisticians Bill James and Simon Kuper discuss the impact of data analysis on sports, exploring how numbers revolutionize strategies and decision-making in athletics.