Statistical Rethinking 2023 - Multilevel Models
Explore multilevel models, partial pooling, and hyperparameter tuning through practical examples like reedfrogs. Learn advanced techniques for statistical analysis and model optimization.
Statistical Rethinking 2023 - Counts & Hidden Confounds
Explore hidden confounds in statistical analysis, sensitivity analysis, and poison counts. Learn about Simpson's paradox and its implications for data interpretation.
Statistical Rethinking 2023 - Elemental Confounds
Explore key concepts in causal inference: the fork, pipe, collider, and descendant. Learn to simulate interventions and understand elemental confounds in statistical analysis.

Statistical Rethinking 2022 - Horoscopes
Explore statistical rethinking through subjective responsibilities, planning, working, reporting, and scientific reform. Gain insights into research methodologies and their practical applications.
Detecting Price and Volume Patterns with SQL and TimescaleDB
Learn to detect stock price patterns using SQL and TimescaleDB. Explore PostgreSQL functions, TimescaleDB features, and analyze real-world examples to identify bullish engulfing and three-bar breakout patterns.

TimescaleDB - PostgreSQL for Time-Series Data
Explore TimescaleDB for efficient time-series data management in PostgreSQL, focusing on stock market applications and practical coding examples.

How to Get Free Traffic From Quora
Learn 8 professional tips to drive free website traffic from Quora, including question research, answer templates, SEO strategies, and effective use of Quora Spaces to promote services and affiliate links.
Macros, Global Variables, Inline Functions & Default Args
Explore macros, global variables, inline functions, and default arguments in C++. Learn key concepts with practical examples and coding tips for efficient programming.

Excel Today - Tips and Tricks
Discover essential Excel techniques to boost productivity. Learn data manipulation, table features, and time-saving functions in this concise, expert-led seminar.

Data Analysis with Excel
Learn to analyze data efficiently using Excel's powerful tools, including sorting, filtering, pivot tables, and data visualization techniques for improved business insights.
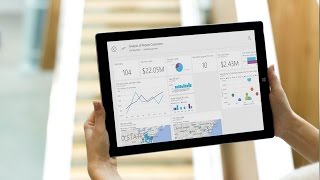
Power BI Training Video
Learn to create impactful data visualizations with Microsoft Power BI. Master data sources, relationships, charts, DAX functions, and publishing for effective decision-making and actionable insights.

Microsoft Excel 2016 - Beginners Tutorial Video
Comprehensive Excel 2016 tutorial covering basics to advanced features. Learn data entry, formulas, functions, pivot tables, charts, and macros. Ideal for beginners seeking to master Excel essentials and beyond.

Excel Today - Power Pivot Tables
Explore Power Pivot Tables in Excel: create dynamic data models, use DAX for advanced analysis, and master efficient keyboard shortcuts for enhanced productivity.
Excel - Visualize Your Data
Unlock Excel's data analysis power: learn XLOOKUP, Pivot Tables, Slicers, and Timelines to visualize and extract insights from large datasets.
Visualizing Data with Power BI
Explore data visualization techniques using Power BI, covering key features, data modeling, and creating impactful visualizations for effective business intelligence and reporting.
Excel for Emerging Leaders - Use Excel to Look Like a Boss
Master Excel skills for leadership: data retrieval, validation, XLOOKUP, tables, and advanced functions. Enhance decision-making and efficiency in your professional role.

Word 2021 Full Course Tutorial
Comprehensive tutorial covering Microsoft Word 2021 features, from basics to advanced functions. Learn text formatting, document design, collaboration tools, and automation techniques for efficient word processing.
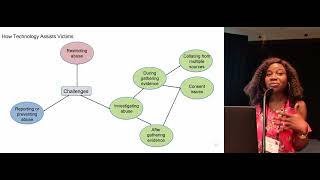
SoK- The Dual Nature of Technology in Sexual Assault
Explores technology's role in sexual assault, examining both its potential for harm and its capacity to support victims, with recommendations for improved safety and support.
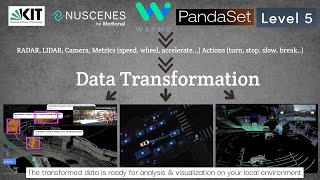
Transform Open-Source Self-Driving Cars Data to Analyze and Visualize Locally with Streetscape.gl
Learn to visualize and analyze self-driving car datasets locally using streetscape.gl. Step-by-step guide to download, transform, and explore KITTI and NuScenes data with open-source tools for in-depth autonomous vehicle analysis.
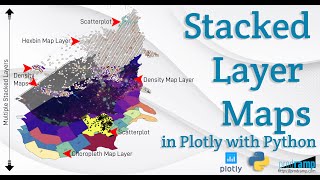
Beautiful and Informative Multilayer Stacked Geo Maps in Plotly With Python
Learn to create multi-layer stacked geo maps in Plotly with Python, combining hexbin, scatter, and density layers for beautiful and informative geospatial data visualizations and dashboards.
Prepare Your Data for Machine Learning Like a Rockstar Data Engineer With DataRobot AI Platform
Learn to prepare data for machine learning using DataRobot AI Platform. Covers AI catalog creation, EDA, feature engineering, outlier detection, data joining, and more. Ideal for data engineers and analysts.