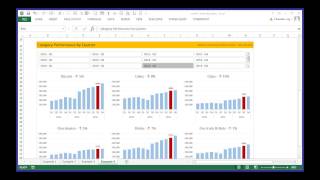
Productivity Revolution in Excel
Discover how to leverage Excel and Power BI for powerful business intelligence. Learn to create charts, dashboards, and formulas, and master data extraction, modeling, and visualization techniques.
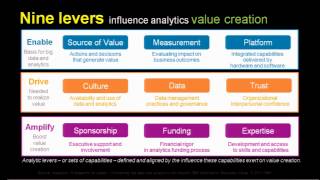
What it Takes to Create Value from Data and Analytics
Explore key capabilities and practices for leveraging data analytics to drive smarter decisions, enable faster actions, and optimize outcomes in today's competitive business landscape.
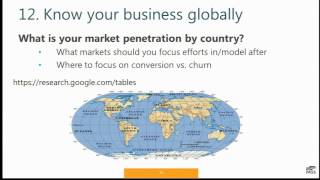
Growth Hacking Using Data
Learn data-driven growth strategies, including identifying key metrics, analyzing engagement, understanding funnels and cohorts, and effectively communicating insights to drive business decisions and success.
Managing Big Data Teams in a Big Company
Insights on evolving big data analytics teams in large corporations, covering changing landscapes, data scientist roles, and teamwork strategies, with best practices and challenges.
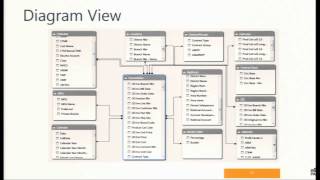
The Reality of Industrial Strength Excel - A Case Study
Discover how Excel revolutionized Kaman Industrial Technologies' performance measurement, driving micro-changes across 180+ locations and improving profitability in just four months.
3D Visualization and Storytelling with Power Map for Excel
Explore Power Map's 3D visualization capabilities in Excel for immersive geographic and temporal data discoveries. Learn to create cinematic tours for sharing geospatial insights across industries.
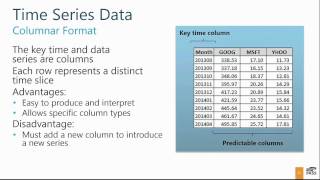
Introduction to Time Series Forecasting
Learn intuitive time series forecasting using Microsoft's algorithm in SQL Server Analysis Services. Explore data preparation, model creation, querying, and result interpretation through Visual Studio and Excel demonstrations.
Using Data to Make Decisions
Learn practical techniques for leveraging data to simplify complex decisions, from buying cars to choosing healthcare, using precision questions, machine learning, and common tools like Excel and T-SQL.
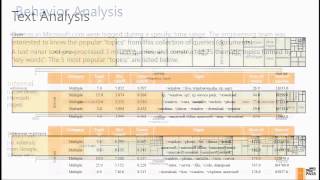
Unlocking Business Value with Advanced Analytics
Practical applications of advanced analytics for business problems, including customer churn reduction, targeting, and segmentation. Learn from Microsoft's data scientists solving real-world challenges.
Bridging the Gap Between Decision Makers and Advanced Analytics
Explore embedding advanced analytics in decision support systems to bridge the gap between potential and actual business impact, enhancing value creation across organizations.
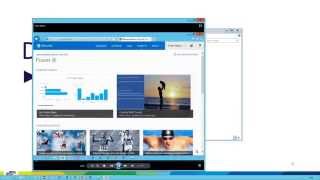
Past to Future - Self-service Forecasting with Microsoft BI
Explore time series forecasting with Microsoft Self-Service BI tools. Learn fundamentals, Excel capabilities, and Power View's predictive analytics for visually impressive forecasts and hindcasts.
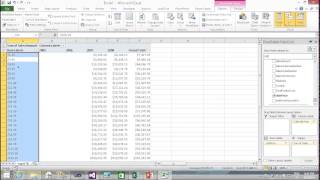
Create Your First SSAS Tabular Model
Learn to create your first Analysis Services Tabular model using Visual Studio. Import tables, establish relationships, and write formulas for data browsing with Excel and Power View.
Business Intelligence Toolkit Overview - Microsoft Power BI and R
Explore data visualization with Power BI and R, focusing on cognitive psychology theory and practical applications for creating effective dashboards and analyses.
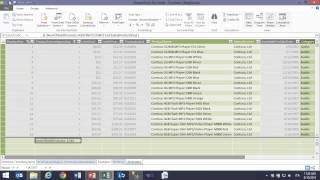
DAX Formulas in Action
Explore DAX formulas for BI solutions in Excel and SQL Server. Learn to create calculated columns, measures, and effective PivotTable analysis through hands-on demonstrations.
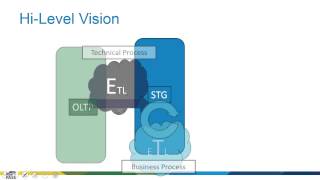
Agile Data Warehousing - Start to Finish
Learn agile data warehousing techniques to streamline production, maintenance, and evolution using SQL Server Data Platform, balancing cost-cutting and resource investment for optimal business value.
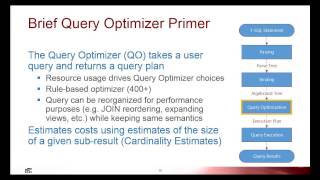
Changes to Query Plans
Explore SQL Server 2014's impact on query plans, focusing on statistics management for large tables and the redesigned cardinality estimator for improved plan costing and performance optimization.
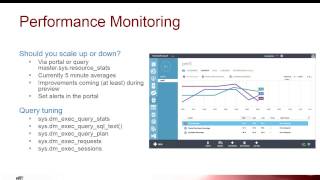
Designing Modern Apps Using New Capabilities in Azure SQL Database
Explore Azure SQL Database's latest features for designing mission-critical cloud applications, focusing on business continuity and performance optimization through architectural patterns and demos.
A Case Study Featuring In Memory OLTP and Hybrid Cloud Scenarios
Practical insights on upgrading mission-critical databases to SQL Server 2014, implementing In-Memory OLTP, Managed Backup, and Azure Storage integration for large workloads.
Power BI Deep Dive
Explora las nuevas capacidades de Excel y Office 365 para Business Intelligence. Descubre, analiza y visualiza datos en Excel, y comparte tus hallazgos a través de Office 365.
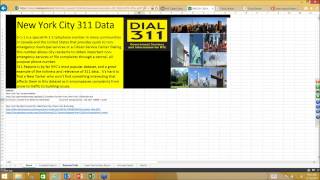
Unlocking Data Insights
Empower users with robust BI tools to transform raw data into business insights. Learn to enable easy data access, leverage Microsoft's tools, and build a comprehensive data platform across on-premises, cloud, and devices.
Dark Matter - Domain Experts & Nextgen Spreadsheets Are Our Future
Unlocking organizational potential through domain expertise and advanced spreadsheets. Learn to leverage existing knowledge, improve data strategies, and turn Excel into a competitive advantage.