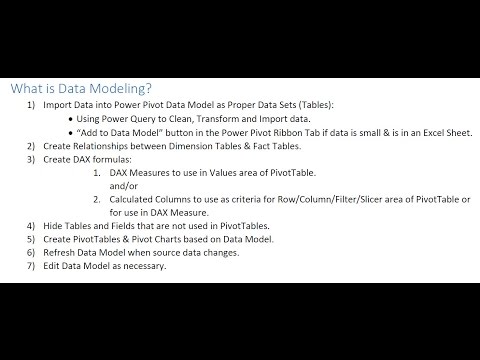
#Pivot Charts
Showing: 9 courses
22 Lesons
1 hour 5 minutes
On-Demand
Free-Video
6 Lesons
33 minutes
On-Demand
Free-Video

9 Lesons
39 minutes
On-Demand
Free-Video

22 Lesons
1 hour 49 minutes
On-Demand
Free-Video

27 Lesons
2 hours 23 minutes
On-Demand
Free-Video

31 Lesons
2 hours 7 minutes
On-Demand
Free-Video

33 Lesons
49 minutes
On-Demand
Free-Video

12 Lesons
12 minutes
On-Demand
Free-Video

21 Lesons
25 minutes
On-Demand
Free-Video