Description:
Save Big on Coursera Plus. 7,000+ courses at $160 off. Limited Time Only!
Grab it
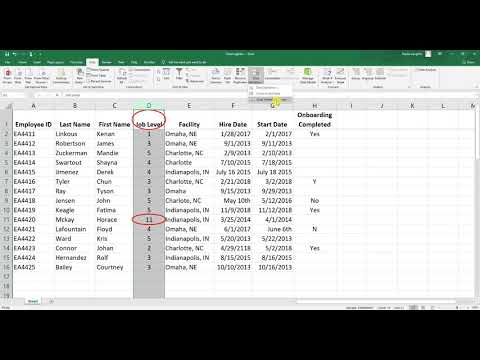
Learn essential Excel skills for human resource management through a comprehensive series of tutorials. Master data cleaning techniques, apply the 4/5ths rule, evaluate disparate impact, calculate means and standard deviations, perform correlation analysis, conduct independent-samples t-tests, and create scatterplots and bar charts for data visualization. Gain practical knowledge to effectively analyze and present HR-related data using Excel's powerful features.
Excel Tutorials
Add to list
#Business
#Business Software
#Microsoft Office 365
#Microsoft Excel
#Data Science
#Data Visualization
#Data Analysis
#Data Cleaning
#Human Resource Management
#Mathematics
#Statistics & Probability
#Correlation
#Bar Charts
#t-tests
#Scatterplots