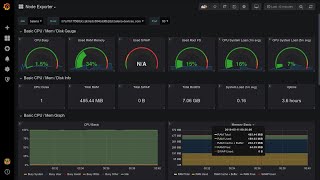
Installing and Configuring Prometheus - A Comprehensive Guide
Install, configure, and leverage Prometheus for effective system monitoring. Master data collection, querying, visualization, and alerting to gain valuable insights into your applications and infrastructure.

Prometheus Certified Associate (PCA) Certification Overview and Demo
Explore Prometheus certification, prepare with resources, and learn to instrument applications for data pushing to Prometheus via pushgateway. Includes demo and comprehensive course overview.
Building Resilient Systems with Chaos Engineering - Preventing Outages
Explore chaos engineering with LitmusChaos to enhance cloud-native app resilience. Learn to identify vulnerabilities using GitOps and monitoring, integrated with Backstage for streamlined management.
KubeVirt Observability with Prometheus and Grafana
Explore KubeVirt observability using Prometheus and Grafana for enhanced monitoring and visualization of virtualized workloads in Kubernetes environments.
Crash Course in Kubernetes Monitoring
Learn to instrument applications, gather metrics, and act on aggregate data for effective Kubernetes monitoring using Prometheus and Grafana in cloud-native environments.
A Glance at the Java Performance Toolbox
Explore essential JDK tools for Java performance analysis, including jcmd, jconsole, and jfr. Learn to gather insights on classes, threads, and GC to optimize your application's efficiency.
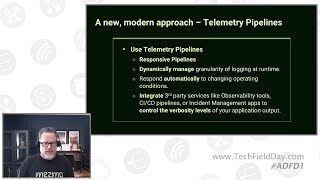
Optimizing Telemetry Data Analysis and Log Management with Mezmo
Master telemetry data optimization techniques for DevOps and SREs - from data profiling and cost management to real-time monitoring and sensitive data handling in observability platforms.
Thanos - Возможности Prometheus с Высокодоступным Кластером и Долгосрочным Хранилищем
Discover how Thanos enhances Prometheus capabilities with high-availability clustering and long-term storage solutions for efficient metric data management and historical analytics across distributed systems.
Real-time Monitoring in a Containerized Environment Using Portainer, Prometheus and Grafana
Master effective container monitoring using Portainer, Prometheus, and Grafana, including optimization techniques, production challenges, and practical solutions for infrastructure oversight.

Observable Elixir - Making Elixir Systems Observable
Explore Elixir system observability through logs, metrics, and traces. Learn structured logging, PromEx setup, and OpenTelemetry basics for improved system understanding and monitoring.

Building a Scalable Ecosystem for High-Load Multiplayer Games
Explore scalable ecosystem development for high-load multiplayer games. Learn CI/CD, backend infrastructure, blue/green deployment, and effective update strategies for seamless gaming experiences.
Practical AI with Machine Learning for Observability in Netdata
Explore AI-driven observability in Netdata, comparing traditional monitoring with innovative approaches. Learn about distributed monitoring, anomaly detection, and future ML developments for enhanced system insights.
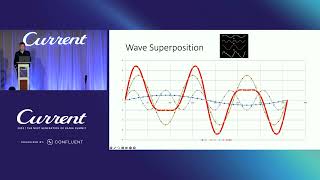
Fast Fourier Transform (FFT) of Time Series in Kafka Streams
Explore digital signal processing with Kafka Streams, transforming time-domain signals to frequency domain using FFT. Learn to build a precise frequency alert system and visualize results in real-time.
從零開始打造私有雲的 Kubernetes 監控 - 使用 Prometheus 和 Grafana
從零開始學習如何使用Prometheus和Grafana為私有雲Kubernetes建立監控系統,並了解常用CRDs以創建自定義監控報表。

Grafana 全家桶:打造高可用且具可擴充性的 O11y 平台
探索如何利用Grafana生態系打造高可用、可擴充的監控平台,涵蓋metrics、logging和tracing,並與常見解決方案比較優勢。
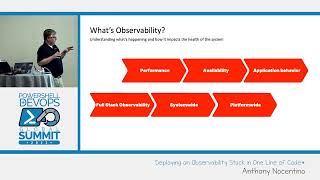
Deploying an Observability Stack in One Line of Code - PowerShell Summit 2023
Deploy an observability stack efficiently with a single line of code, enhancing system monitoring and troubleshooting capabilities for improved performance and reliability.
Building Sustainable Open Source - Seven Key Lessons After 5 Years of Leading The Thanos Project
Discover seven crucial lessons for sustainable open-source development from the Thanos Project's five-year journey, led by a Google Principal Software Engineer.
Do-It-Yourself vs. Managed: Observability Tooling Considerations for Google Kubernetes Engine
Explore DIY vs. managed observability tooling for GKE, comparing open source and managed services. Learn from Wayfair's cost-saving transition and other customer examples.
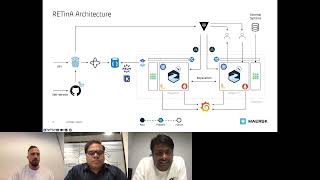
Transition to Apache Kafka on Kubernetes with Strimzi - A Migration Case Study
Explore Maersk's migration from Confluent to self-managed Apache Kafka on Kubernetes using Strimzi. Learn about architecture, implementation, monitoring, and self-service solutions for large-scale event streaming platforms.
Progressive Delivery in the Kubernetes Era
Explore progressive delivery techniques for Kubernetes, including blue-green deployments, canary releases, and GitOps, to safely validate applications in production using tools like Istio, Prometheus, and Argo.
Strengthening Software Operations: Observability, Encryption, and SSO - Operator Day Insights
Strengthen software operations with predictive observability, certificate-based encryption, and simplified SSO. Learn to integrate tools, secure communications, and automate identity management for enhanced efficiency and security.