Intro to Plotly Express - Complex Interactive Charts with One Line of Python Code
Create interactive data visualizations, including the Gapminder Animation, using Plotly Express in Python with minimal code. Learn to build and enhance plots step-by-step for effective storytelling.

Effortless Data Analysis and Cleaning with Data Wrangler in VS Code
Explore Data Wrangler in VS Code: Boost productivity with code-centric data cleaning, automated Pandas code generation, and insightful visualizations for efficient data analysis.
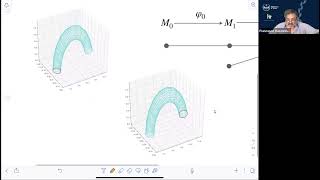
Parallel Decomposition of Persistence Modules Through Interval Bases
Explore parallel decomposition of persistence modules using interval bases, enhancing Topological Data Analysis with distributed computation and Hodge decomposition techniques.

Python for Data Science
Comprehensive guide to mastering Numpy, Pandas, and Plotly for data science in Python. Covers core concepts and practical applications with free, commented code files for hands-on learning.

The Forgotten Route: Making Apache Camel Work for You
Discover Apache Camel's hidden potential for efficient data flow and integration. Learn configuration tricks, implement Enterprise Integration Patterns, and explore real-world examples with JMS, FTP, and HTTP endpoints.
How to Build an LMS Course Website with WooCommerce and Elementor 2023 - No LMS Plugin
Learn to create an LMS course website using WooCommerce and Elementor without plugins. Covers course setup, delivery, promotion, access restriction, and product automation.
Financial Analyst App - GPT-4, Streamlit, and Llama-Index Tutorial
Build a financial news app UI with Streamlit, integrating GPT-4 and Llama-Index for advanced analysis and user-friendly interaction. Learn to create a powerful tool for financial insights.
Data Visualization in Python - Altair Scales, Axes, and Legends - Lecture 4
Master Altair's scales, axes, and legends for effective data visualization in Python. Learn to customize charts, enhance readability, and extract insights using advanced techniques and color encoding.
Data Visualization in Python - Altair Data Preparation Techniques
Explore data preparation techniques in Altair for effective visualization, including aggregation, binning, time unit transforms, and filtering to shape and analyze your data effectively.
Data Visualization in Python - Building Blocks of Altair - Tutorial Series Part 2
Explore Altair's fundamental components for data visualization in Python, including data types, graphical marks, and visual encoding channels. Learn to create interactive and customizable charts.
Data Visualization in Python - Altair 4.2 Tutorial
Comprehensive tutorial on Altair for data visualization in Python, covering setup, basic plots, customization, interactivity, and advanced features. Ideal for beginners and intermediate users.
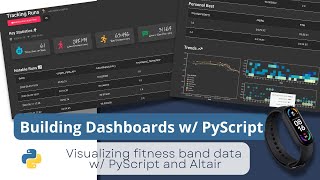
Building Dashboards with PyScript and Altair - Part 1
Learn to build interactive dashboards using PyScript, Altair, and Pandas. Create visually appealing data visualizations from fitness tracker data with step-by-step guidance on data processing and chart customization.
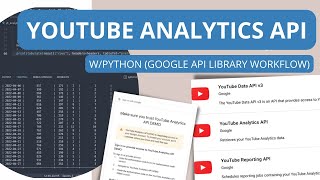
YouTube Analytics and Data API with Python - May 2022 Update
Learn to use YouTube Analytics and Data APIs with Python, covering setup, authentication, data retrieval, and creating CLI tables. Gain practical skills for working with Google's latest API libraries.
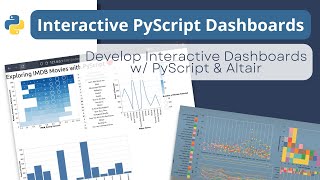
Building an Interactive Dashboard with PyScript and Altair - Tutorial 3
Learn to create an interactive dashboard using PyScript and Altair, from setup to deployment. Covers importing dependencies, building visualizations, and deploying the final product on GitHub Pages.

Data Visualization in React Using Gatsby - Learn With Jason
Learn to create SSR-friendly data visualizations using D3, React, and Gatsby for high-performance progressive web apps. Explore techniques for building interactive and efficient dataviz components.

Use Airtable as a CMS for Gatsby - Learn With Jason
Learn to build a Gatsby site using Airtable as a CMS. Explore creating databases, relationships, and API integration for a dynamic portfolio website.
How to Start an Email Newsletter with MailChimp in 2022
Learn to create and manage an email newsletter using MailChimp's free tools. Covers setup, design, and sending your first email, with tips on driving traffic and increasing sales.
Top Tools for Blogging and Content Creators
Comprehensive guide to essential tools for bloggers and content creators, covering website creation, content management, social media, and brand growth strategies.
Google Analytics - A Beginner's Guide
Learn to navigate Google Analytics, understand website traffic, and gain insights on audience, acquisition, and behavior to improve your online presence and marketing strategies.
Accessing Elements of NDArray in NumPy - Python Programming
Learn to access elements in NumPy ndarrays, from basic indexing to multi-dimensional array manipulation, enhancing your Python data handling skills.

The Best Way to Become a Backend Software Engineer
Discover effective strategies for becoming a backend software engineer, including learning CS fundamentals, choosing the right programming language, and leveraging public learning to secure high-paying jobs.