Knowing Your Garbage Collector
Explore Python's garbage collection mechanisms, including reference counting and cycle detection in CPython, and the MiniMark GC in PyPy. Gain insights into memory management and potential issues.
Measuring Memory - Python Memory Profilers and When to Use Them
Learn to measure and optimize Python memory usage, exploring profilers for different scenarios like web apps and data processing to prevent crashes and improve performance.

The Memory Leak Brain Drain – Workshop
Explore memory leaks in Angular applications, their causes, and effective strategies for detection and prevention to optimize performance and enhance user experience.

Uptime - Building Resilient Services with Go
Explore resilient Go service development, focusing on concurrency, error handling, memory management, and monitoring techniques for improved performance and reliability.

Doing the Least Amount of Work - An Intro to Runtime
Explore techniques to optimize app performance, from identifying issues to debugging memory leaks, ensuring peak efficiency while keeping stakeholders satisfied.
Effectively Managing Memory at Gmail Scale
Explore effective memory management techniques for large-scale web apps, focusing on Gmail's optimization strategies and using Chrome DevTools Heap Profiler for performance enhancement.
Performance Profiling for V8
Dive deep into V8's inner workings to identify and fix JavaScript performance issues. Learn about memory leaks, cache misses, garbage collection, and deoptimizations using Chrome's profiling tools.
Deep .NET Debugging
Learn advanced techniques for troubleshooting complex .NET issues like hangs, memory leaks, and crashes through hands-on demonstrations and expert insights.
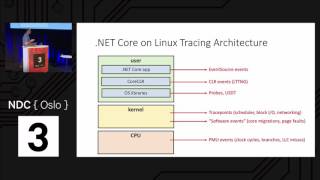
Debugging and Profiling .NET Core Apps on Linux
Explore Linux-based debugging and profiling techniques for .NET Core apps, including perf, LTTNG, and core dump analysis, to tackle production issues and optimize performance.
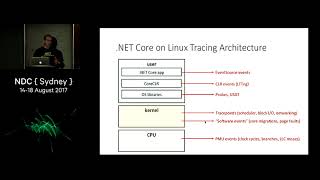
Debugging and Profiling .NET Core Apps on Linux
Explore Linux-specific tools for debugging and profiling .NET Core apps, including perf, LTTNG, and core dump analysis, to tackle production issues and optimize performance.
Self-Awareness in C++ Code
Explore techniques for building a memory profiler in C++, focusing on strategies to intercept memory allocations, capture call stacks, and analyze memory usage patterns for optimization and debugging.

Taming Memory Leaks in Node.js - A Deep Dive
Dive into memory leak detection and prevention in Node.js applications, exploring diagnostic tools, common causes, and practical solutions for maintaining optimal application performance.

Severing Ties: The Need for Non-Updateable Thunks
Explore non-updateable thunks in Haskell to prevent memory leaks and optimize garbage collection in streaming abstractions and control flow scenarios.
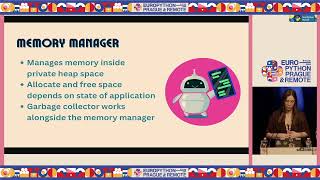
Is It Me or Python Memory Management? - Understanding and Optimizing Memory Usage
Explore Python memory management, analyze usage, and learn optimization techniques for efficient, memory-conscious coding as applications scale and complexity grows.
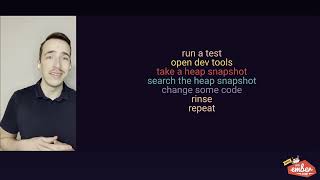
Ending the Plague of Memory Leaks
Discover techniques to detect, diagnose, and fix memory leaks in single-page apps using ember-cli-memory-leak-detector, a new addon revolutionizing Ember development.
A Pragmatic and Simple Approach to Fixing a Memory Leak in Rails - RailsConf 2023
Discover practical techniques for identifying and resolving memory leaks in Rails applications without specialized tools or extensive knowledge.
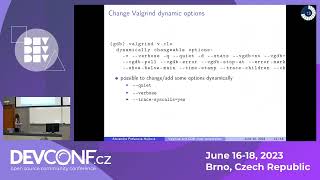
Debugging Memory Issues with Valgrind and GDB
Discover techniques for debugging memory issues using Valgrind and GDB in C/C++ programs. Learn to identify and resolve buffer overflows, memory leaks, and other low-level errors efficiently.
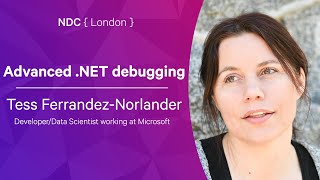
Advanced .NET Debugging
Explore advanced .NET debugging techniques for memory leaks, performance issues, and crashes. Learn to use dumps, traces, and CLR internals for effective troubleshooting and optimizing application performance.

LeakCanary, Then What? Nuking Nasty Memory Leaks
Discover advanced techniques for detecting and resolving memory leaks in Android apps, building upon LeakCanary's capabilities for improved app performance and stability.
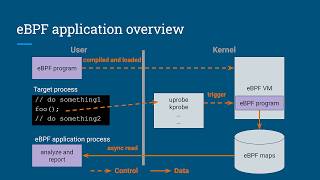
Detect C++ Memory Leaks with ALSan: Attachable Leak Sanitizer - Lecture
Discover ALSan, a new tool for detecting memory leaks in running processes without restarting. Learn how it leverages eBPF to reduce debugging time and improve issue detection.

In Memory of Travails - Memory Optimization and Performance Strategies in GraphQL
Dive into advanced memory optimization techniques for GraphQL applications, exploring real-world strategies from Auction.com's performance enhancement journey and subscription management.