Excel Statistical Analysis - Hypothesis Testing - P-Value & Critical Value Methods - 1 Tail Upper
Master hypothesis testing in Excel: learn 5-step process, P-value and Critical Value methods for one-tail upper tests. Practical example using realtor salary data enhances understanding of statistical concepts.
Excel Statistical Analysis - Learn Central Limit Theorem by Building Sampling Distribution of Xbar
Explore the Central Limit Theorem through practical Excel exercises, learning to build sampling distributions and apply statistical concepts for informed business decision-making.
Excel Statistical Analysis - Binomial Probability Distributions - BINOM.DIST.RANGE Function & Chart
Master binomial probability distributions in Excel using BINOM.DIST.RANGE function. Learn formulas, create charts, and analyze real-world scenarios to enhance your statistical analysis skills.
Excel Statistical Analysis - Build Discrete Probability Distributions with Worksheet Formulas
Learn to create discrete probability distributions using Excel formulas. Master expected value, standard deviation, charting, and applying these concepts to real-world business scenarios for data-driven decision-making.
Excel Statistical Analysis - AND, OR, and NOT Logical Tests for COUNTIFS & FILTER Functions
Master Excel's AND, OR, and NOT logical tests for COUNTIFS and FILTER functions. Learn to analyze data using Venn diagrams, mutually exclusive events, and probability concepts.
Excel Statistical Analysis - Introduction to Probability, Power Query & Pivot Table Example
Aprenda os fundamentos de probabilidade em Excel, incluindo experimentos aleatórios, espaço amostral, combinações e permutações. Aplique conceitos em exemplos práticos de negócios usando Power Query e Tabelas Dinâmicas.
Excel Statistical Analysis - 5-Number Summary - Box & Whiskers Chart - Power Query & Array Formulas
Aprenda a criar análises estatísticas avançadas no Excel usando Power Query, fórmulas de matriz e gráficos Box & Whiskers para visualizar e interpretar conjuntos de dados complexos.
Excel Statistical Analysis - Range, Variance, Standard Deviation, Coefficient of Variation
Master Excel's statistical analysis tools for calculating range, variance, standard deviation, and coefficient of variation. Apply these measures to make informed business decisions and interpret financial data.
Excel Statistical Analysis - Location, Mean, Median, Mode, Moving Average, Skew & More
Comprehensive guide to Excel statistical analysis, covering mean, median, mode, moving averages, and skew. Includes practical examples using Power Query, PivotTables, and dynamic arrays for data visualization and interpretation.
Excel Statistical Analysis - Cross Tabulation, Visualizations, and Logical Tests, Simpson’s Paradox
Master cross tabulation, visualizations, and logical tests in Excel. Learn to create insightful reports, understand Simpson's Paradox, and effectively analyze data relationships using PivotTables and charts.
Excel Statistical Analysis - Frequency Distributions, Visualizations & Skew for Quantitative Data
Master frequency distributions and data visualizations in Excel, including column charts, histograms, and line charts. Learn to analyze discrete and continuous data, handle time series, and interpret skew in distributions.
Excel Statistical Analysis - Frequency Distributions & Visualizations for Categorical Data
Learn to create frequency distributions and visualize categorical data using Excel. Master PivotTables, column/bar charts, and advanced techniques for effective data presentation and analysis.
Excel Statistical Analysis - PivotTable & Power Query to Build Frequency Distributions
Master PivotTables and Power Query for creating frequency distributions from various data types. Learn efficient techniques for data import, transformation, and analysis in Excel.
Excel Statistical Analysis - Comprehensive Worksheet Formula & Model Building
Master Excel formulas and model building, from basic elements to advanced techniques like Dynamic Spilled Array Formulas. Learn efficient methods for data analysis and presentation in Microsoft 365 Excel.

Basic Excel Business Analytics - Intro to Linear Programming Using Algebra, Pencil & Paper
Introduction to linear programming using algebra and graphing methods to solve manufacturing problems and maximize contribution margin, with focus on mathematical modeling and feasible region analysis.
Basic Excel Business Analytics - Forecasting with Linear Regression: Trend & Seasonal Pattern
Learn advanced Excel forecasting techniques using linear regression for trend and seasonal pattern analysis, including FORECAST function and multiple regression with categorical variables.
PivotTables & Slicers - Create Dashboards & Summary Reports
Master PivotTables, Slicers, and dashboards in Excel. Create cross-tab reports, frequency distributions, and custom calculations for effective data analysis and visualization.
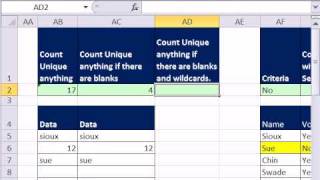
Excel Magic Trick - FREQUENCY Array Function
Comprehensive tutorial on Excel's FREQUENCY function, covering various applications from basic usage to advanced techniques for data analysis and unique item extraction.

Every Cube Example Solve
Comprehensive guide to solving various Rubik's cube puzzles, from beginner to advanced levels. Includes tutorials for 2x2, 3x3, 4x4, 5x5, and special cubes with step-by-step demonstrations.

Solving a Puppet Cube Without Help
Explore the challenging Puppet Cube puzzle with a skilled cuber as he attempts to solve it without assistance, sharing insights, strategies, and step-by-step problem-solving techniques along the way.
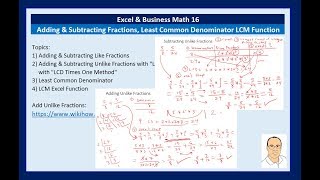
Excel & Business Math - Fun With Adding & Subtracting Fractions & Least Common Denominator
Learn to add and subtract fractions efficiently using the "LCD Times One Method" with practical examples on paper and in Excel. Enhance your math skills through engaging exercises and clear explanations.