
Introducción al Charm de Loki para Kubernetes - COS-Lite (En Español)
Descubre Loki: su funcionamiento, relaciones, métodos de recepción de logs y uso práctico. Explora el código fuente del charm y su integración con otros componentes en Kubernetes.
How Grafana Labs Builds and Sustains Communities
Explore Grafana Labs' strategies for building thriving open-source communities, drawing from decades of experience in fostering collaboration and sustainable growth in large-scale projects.
Применение Grafana Stack для Централизованного Логирования и Трейсинга
Узнайте, как эффективно внедрить Grafana stack для централизованного логирования и трейсинга, включая миграцию с Elastic на Loki и Tempo, масштабирование и решение технических проблем.
Revolutionizing 5G Infrastructure - OpenRAN, LOKI, and the Open Telecom
Explore the evolution of 5G networks through OpenRAN architecture, discovering how cloud-native functions and containerized components enable flexible, cost-effective network deployment and innovation.
LOKI and AIops in China Mobile Cloud Computing Architecture
Discover how China Mobile's LOKI system integrates with BC-EC computing architecture to enable AI-driven operations, enhancing cloud service management and operational efficiency for enterprise solutions.
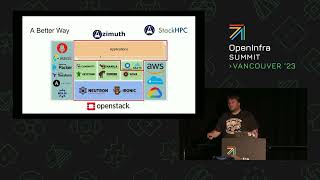
Self-Service LOKI Applications for Non-Technical Users with Azimuth Platform
Discover how Azimuth enables non-technical users to self-deploy and manage complex applications on LOKI through a simple web interface, featuring SSO authentication and support for advanced hardware capabilities.
Threat Hunting at Scale - Auditing Thousands of Clusters With Falco and Fluent
Explore large-scale threat hunting using Falco and Fluent for auditing thousands of Kubernetes clusters, covering data pipelines, monitoring, log processing, and challenges.
Observability at Scale: Collecting Telemetry from Over 10,000 Edge Devices Worldwide
Explore how Open Systems manages observability for 10,000+ global edge devices, collecting 100M+ metrics and 5 TiB logs daily using Thanos and Loki. Learn challenges, solutions, and insights for monitoring large distributed systems.
Cloud-Native Metric Monitoring with Prometheus
Explore cloud-native metric monitoring with Prometheus, covering its key features, concepts, and integration with Grafana Labs' tools for comprehensive observability and efficient system management.
Avis Budget Group's Journey to Modern Observability with Open-Source Tools
Explore Avis Budget Group's transition to modern observability using open-source tools. Learn about cloud-native architecture, CNCF project tools, and real-world problem-solving with OpsCruise's platform.
Observability with Prometheus and Beyond - Leveraging Cloud-Native Technologies Outside of Cloud
Explore cloud-native observability tools like Prometheus and Loki, learning their key features, scalability, and integration for effective monitoring and troubleshooting in various environments.

Intro to Open Source Observability With Grafana, Prometheus, Loki, and Tempo
Explore open source observability tools like Grafana, Prometheus, Loki, and Tempo. Learn their philosophies, integrations, and best practices for effective monitoring and visualization of complex systems.
Inside Kubernetes, Outside the Box - Gaining Visibility with Crossplane
Explore Kubernetes and Crossplane Control Planes for enhanced system visibility and management. Learn to monitor control and data planes, use Prometheus for metrics, and leverage Grafana and Loki for comprehensive system awareness.
Chaos Drive - Briefly Known as Loki
Explore the intriguing world of Chaos Drive, formerly known as Loki, in this captivating presentation by Michael Rich on cutting-edge cybersecurity concepts and techniques.
Observability with Consul Connect
Explore setting up and observing a service mesh platform using Consul Connect, focusing on effective monitoring through metrics, logs, and traces with Prometheus, Loki, Tempo, and Grafana.
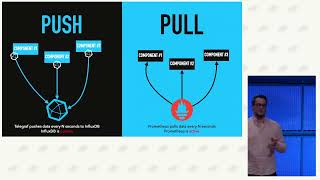
Modern Observability - Scalable Observability with the LGTM Stack - Harnessing the Power of Loki, Grafana, Tempo, and Mimir
Explore advanced observability using the LGTM stack (Loki, Grafana, Tempo, Mimir). Learn how it integrates with OpenTelemetry to enhance monitoring and tracing for high-performance systems.

Grafana 全家桶:打造高可用且具可擴充性的 O11y 平台
探索如何利用Grafana生態系打造高可用、可擴充的監控平台,涵蓋metrics、logging和tracing,並與常見解決方案比較優勢。
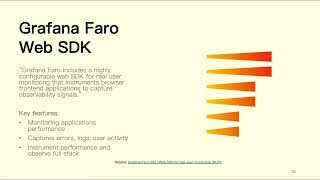
Grafana Alloy Best Practices: Multi-Tenant Design, Performance Optimization, and End-to-End Tracing
探索Grafana Alloy的多租户設計、性能優化和端到端追蹤,學習實施最佳實踐以提升監控和可觀察性能力。
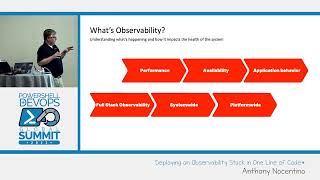
Deploying an Observability Stack in One Line of Code - PowerShell Summit 2023
Deploy an observability stack efficiently with a single line of code, enhancing system monitoring and troubleshooting capabilities for improved performance and reliability.
Watching the Watchers: How We Do Continuous Reliability at Grafana Labs
Discover how Grafana Labs tackles production incidents, scales observability tools, and maintains reliability through real-world examples of monitoring challenges, failures, and successful solutions.