
Upping Your Data Viz Game - Effective Storytelling and Visualization Techniques
Enhance data visualization skills with storytelling techniques, effective color usage, and uncertainty representation. Learn from expert insights to create impactful and informative visual presentations.

Monopoly Pricing and Durable Goods - Part 1
Explore monopoly pricing strategies and durable goods economics, focusing on information design in monopolistic markets. Gain insights into industrial organization principles.

Monopoly Pricing and Durable Goods - Lecture 2
Explore monopoly pricing strategies and durable goods economics. Gain insights into information design and long-term consumption patterns in industrial organization theory.

What Long COVID Taught Me About Life and Data
Discover how data can capture life stories through Giorgia Lupi's personal journey with long COVID. Explore the power of visual narratives in understanding chronic illness and shifting perspectives on data's role in our lives.

Disegnare Rotte Più Consapevoli - Navigating Visual Information Overload
Esplora come il disegno e la sintesi visiva possono aiutarci a navigare il mare di stimoli visivi quotidiani, migliorando la nostra percezione e comprensione della realtà.

Identification and Estimation of Dynamic Structural Models with Unobserved Choices
Explore dynamic structural models with unobserved choices, focusing on identification, estimation, and applications in information design and data science.

Complementary Information and Learning Traps
Explore complementary information sets and their impact on learning efficiency, with insights into learning traps and efficient information aggregation in decision-making environments.

The Importance of Information Presentation in Healthcare
Passionate exploration of how effective information presentation in healthcare can empower patients and improve outcomes, with insights from Wired Magazine's executive editor.

Visualization Techniques for Data Analysis - Session 20
Explore data visualization techniques and best practices for effectively communicating complex information through visual representations.

Data, Meet Design - Making Information Beautiful
Explore how visual arts enhance informed debate on significant issues, focusing on Herbert Bayer's World Geo-Graphic Atlas as a precursor to modern information design.

Balancing Design and Content in Scientific Posters and Figures
Explore effective scientific poster design with expert insights on aesthetics, data visualization, and balancing visual appeal with research content.

Data Sketches: A Year of Exotic Data Visualizations
Explore a year-long data visualization journey, uncovering insights on creative processes, overcoming challenges, and transforming ideas into compelling visual stories.
Visualizing Data for Non-Data Experts - Making Reports Accessible to All
Learn to create accessible data visualizations for all audiences. Identify needs, choose appropriate visuals, and present findings clearly and concisely.

Echoes of Time in Type - Evolution of Typography from Gutenberg to Present
Explore typography's evolution from Gutenberg to modern times, examining its crucial role in communication and design innovation through expert insights and historical analysis.
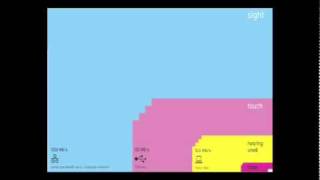
The Beauty of Data Visualization
Explore how complex data sets can be transformed into visually appealing diagrams, revealing hidden patterns and connections to navigate information overload and change our worldview.

Visualizing Cloud Systems
Explore effective visualization techniques for cloud-native systems, focusing on microservices and serverless patterns. Learn to design and implement solutions using visual grammars and dimensionality reduction.

Visual Design - Creating Clean and Aesthetic Data Visualizations
Master the art of creating clean, aesthetic data visualizations through proven best practices and BI tool features to transform complex data into compelling stories that drive innovative business decisions.

The Art and Science of Infographic Design - Balancing Creativity and Data Analysis
Master the balance between creativity and data accuracy in infographic design through real-world examples, exploring effective decision-making techniques for compelling data visualization and analytics.

Advanced Visualization Techniques for Complex Data Sets
Explore advanced visualization techniques for complex datasets, focusing on interactive methods and best practices for large-scale data representation in SRE contexts.

The Good, The Bad, and The Ugly - Creating Effective Diagrams in Software Development
Elevate your diagramming skills with 7 key characteristics and practical tips for creating effective, clear, and valuable visual representations in software development.
Key Practices to Improve Your Data Communication
Master effective data presentation techniques and learn to create visually appealing documents, slides, and charts that enhance communication of insights while avoiding information overload.