
Monitoreando tu Servidor Local Ubuntu con Telegraf, Grafana e InfluxDB
Aprende a monitorear eficazmente tu servidor Ubuntu utilizando Telegraf, InfluxDB y Grafana. Configura estas herramientas para recolectar, almacenar y visualizar métricas en tiempo real.
Introduction to Grafana - Data Visualization and Analytics
Learn to install, configure, and use Grafana for data visualization and analytics. Explore metrics, build dashboards, set up alerts, and import community dashboards in this comprehensive introduction.
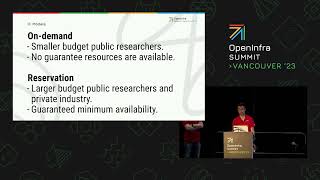
One Nova Cluster to Serve Multiple Computing Needs - Managing On-Demand and Dedicated Instances
Discover how San Diego Supercomputer Center efficiently manages a unified nova cluster serving diverse user needs, from on-demand instances to dedicated hosts, using OpenStack, Ceph, and custom Python solutions.
InfluxDB + Telegraf Operator - Easy Kubernetes Monitoring
Explore easy Kubernetes monitoring using InfluxDB and Telegraf Operator. Learn efficient data collection, storage, and visualization techniques for enhanced cluster management.
Time Series Tech Stack for IoT Edge
Explore the time series technology stack for IoT edge devices, focusing on efficient data collection, processing, and analysis in resource-constrained environments.
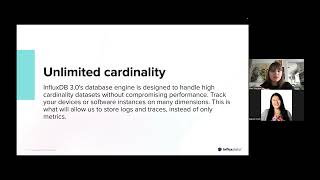
Gain Better Observability with OpenTelemetry and InfluxDB
Explore OpenTelemetry and InfluxDB for enhanced observability in cloud-native environments, improving system monitoring and performance analysis.

InfluxDB & Friends - Home Assistant with Matt Brunt
Explore Home Assistant setup, InfluxDB integration, and Flux tips for smart home automation. Learn about devices, entities, automations, and data management in this comprehensive guide.
Introduction to InfluxDB 2 and Flux - Rawkode Live
Comprehensive introduction to InfluxDB 2 and Flux, covering installation, configuration, metrics exploration, dashboards, tasks, and alerting. Ideal for those interested in time series data management and analysis.
Introduction to Flux - The Complete Guide to InfluxDB 2 - Part 5
Explore Flux query language for InfluxDB 2, covering functions, operators, and data manipulation techniques through hands-on exercises and practical examples.

Introduction to Time Series Data and InfluxDB - Lecture 1
Comprehensive introduction to time series data, exploring its nature, importance, and practical applications. Learn about InfluxDB and effective data management techniques.
Distributed Load Testing with k6
Explore k6, an open-source load testing tool. Learn to create scenarios, set checks, define thresholds, and visualize metrics. Discover how to scale tests across multiple nodes for distributed load testing.
InfluxDB & Rust
Explore InfluxDB 3.0's Rust rewrite, focusing on improved performance, scalability, and observability data handling. Learn about IOx engine, Flux language, and open-source considerations.
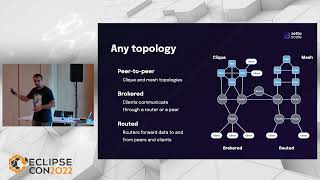
Route and Store MQTT Messages Anywhere with Eclipse Zenoh - Communication Middleware Integration
Discover how to bridge, route, and store MQTT messages across diverse networks using Eclipse Zenoh's plugin system for seamless IoT communication and data management.
Creating an IoT Data Layer for Collecting, Storing, and Analyzing Data
Learn to build an IoT data layer for collecting, storing, and analyzing data across edge and cloud environments using Linux and open-source tools. Explore distributed architectures, time series data, and real-time analytics.
Monitoring Mesos with InfluxDB & the TICK Stack
Learn to monitor Mesos using InfluxDB and the TICK stack. Explore time series data, querying, and visualization tools for comprehensive infrastructure and application visibility.
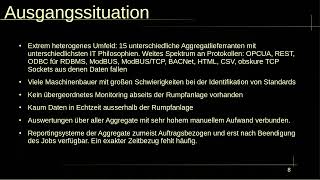
mephisto: Smart Factory: Wie Timeseries-Daten klassische Industrien verändern und zukunftsfähig mach
Implementierung einer IT-Monitoring-Toolchain in der Industrie: Wie Zeitreihendatenbanken und Observability-Plattformen Effizienz steigern, Energieverbrauch senken und Unternehmen zukunftsfähig machen.

A Dashboard Is Worth a Thousand Words - Better Monitoring for Better Ops
Explore how CERN's new monitoring system improved service operations and fostered SRE practices, discussing design decisions, operational challenges, and the benefits of implementing SLIs/SLOs.
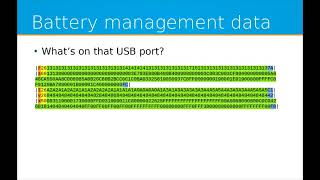
Decoding Battery Management Data - Back in the Old School
Explore decoding battery data from an electric motorbike using Raspberry Pi, Python, and open-source tools. Learn techniques for interpreting binary data from closed systems without documentation.
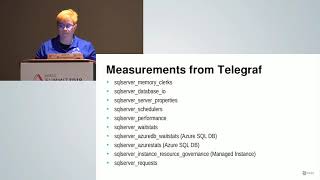
Using Open Source Software to Collect Performance Metrics
Learn to set up an inexpensive system using Telegraf, InfluxDB, and Grafana to collect and visualize SQL Server performance metrics, aiding in troubleshooting and capacity planning.

Infrastructure Monitoring Basics with Telegraf, Grafana and InfluxDB
Learn infrastructure monitoring basics using Telegraf, Grafana, and InfluxDB. Explore data collection, storage, visualization, and alerting techniques to ensure system reliability and performance.
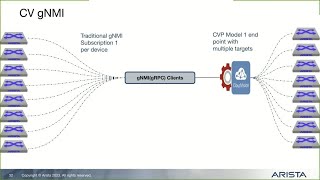
Streaming CloudVision Telemetry to External Sources Using gNMI
Discover how to stream CloudVision telemetry data to external platforms like Influx, Prometheus, and Grafana using gNMI interface for enhanced network monitoring and visualization.