
Power BI Crash Course for Beginners
Learn to import, analyze, and visualize data using Power BI Desktop. Master data cleaning, DAX, Power Query, and create insightful visualizations for effective business intelligence.

All Important Excel Lookup Formulas - Excel Worksheet, Power Query & DAX – 28 Examples
Comprehensive guide to Excel lookup formulas, covering XLOOKUP, FILTER, XMATCH, INDEX, and more. Includes examples in Excel, Power Query, and DAX for exact and approximate matches.

How to Transform Excel Data into a Striking Visual Report with Microsoft Power BI
Transform Excel data into interactive visual reports using Microsoft Power BI. Learn importing, data manipulation, DAX expressions, chart creation, and report customization in this beginner-friendly tutorial.

Power BI Advanced Tutorial
Master advanced Power BI techniques for data analysis and visualization. Learn to build queries, create relationships, use DAX functions, design interactive dashboards, and publish reports online.

Excel Today - Power Pivot Tables
Explore Power Pivot Tables in Excel: create dynamic data models, use DAX for advanced analysis, and master efficient keyboard shortcuts for enhanced productivity.

Fundamentals of DAX in Power BI & Power Pivot
Comprehensive tutorial on DAX fundamentals for Power BI and Power Pivot, covering key concepts, functions, and advanced techniques to enhance data analysis and reporting skills.

Excel Pivot Tables Tutorial - From Basics to Advanced Techniques
Master Excel Pivot Tables: Analyze complex data, create insightful charts, and leverage advanced features like Power Pivot and DAX expressions for powerful data manipulation and visualization.
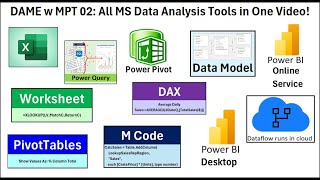
Microsoft Data Analysis Tools: Excel, Power Query, Power BI, Dataflow, DAX and M Code
Comprehensive tutorial on Microsoft data analysis tools, covering Excel, Power Query, Power BI, and more. Learn formulas, data modeling, and visualization techniques for effective data analysis.
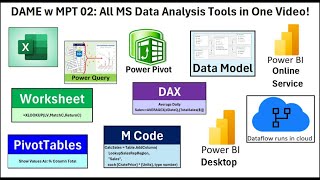
Microsoft Data Analysis Tools: Excel, Power Query, Power BI, Dataflow, DAX, and M Code
Comprehensive tutorial on Microsoft data analysis tools, covering Excel, Power Query, Power BI, and more. Learn to import, transform, and visualize data using various techniques and formulas.
DAX Fundamentals in Power BI and Power Pivot - 2.5 Hour Course
Comprehensive tutorial on DAX fundamentals in Power BI, covering calculated columns, measures, context, functions, and advanced techniques for efficient data analysis and reporting.
Calculate Evaluation Order in Power BI
Learn practical, visual steps to evaluate CALCULATE expressions with multiple filters/modifiers in Power BI, enhancing your data modeling and visualization skills.

Understanding Window Functions in DAX
Explore DAX window functions and apply semantics through examples, gaining insights into their capabilities and performance optimization techniques.

Optimizing DAX Fusion in Power BI
Dive deep into Power BI's DAX engine and learn advanced techniques to optimize DAX fusion for enhanced performance and efficiency.

Using ALLEXCEPT or ALL/VALUES in DAX Calculations
Optimize DAX calculations by mastering when to use ALL/VALUES instead of ALLEXCEPT for improved performance and clarity in data analysis.

DAX in 20 Minutes - The Hard Parts
Master DAX modeling language for Power BI: overcome roadblocks, understand mental models, and learn key differences from Excel formulas in this concise tutorial.

Famfs: New Userspace Filesystem Driver vs. Improving FUSE/DAX
Explore a new userspace filesystem driver, Famfs, and compare it to FUSE/DAX improvements for enhanced file system performance and functionality.
Understanding Numeric Calculations in DAX
Explore DAX's numeric calculations, learning to differentiate between filter and row contexts, and when to use calculated columns versus measures for optimal data analysis and visualization.
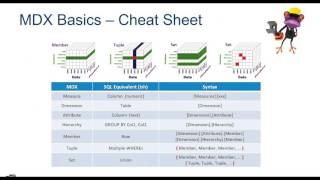
Beginners Guide to MDX
Explore MDX fundamentals, including T-SQL queries, star schemas, and cube visualization. Learn key concepts like sets, tuples, and subcubes through demos and practical examples.
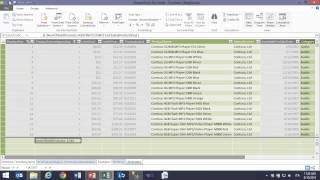
DAX Formulas in Action
Explore DAX formulas for BI solutions in Excel and SQL Server. Learn to create calculated columns, measures, and effective PivotTable analysis through hands-on demonstrations.
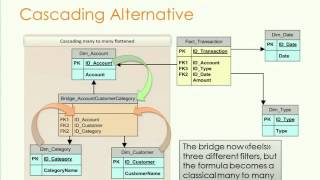
Many-to-Many Relationships in DAX
Explore advanced DAX techniques for handling many-to-many relationships in data modeling, with practical examples and insights into the Vertipaq engine's capabilities.

Power BI Advanced Analysis of Time Dimension with DAX
深入探讨如何在Power BI中使用DAX进行时间维度的高级分析,包括创建日期表、XTD、移动平均线以及基于历史数据的预测分析。