
Excel Data Analysis - Power Pivot, DAX Formulas, Relationships, Data Modeling & Much More
Master Power Pivot and DAX formulas for advanced Excel data analysis. Learn data modeling, relationships, and visualization techniques to create powerful reports and dashboards.
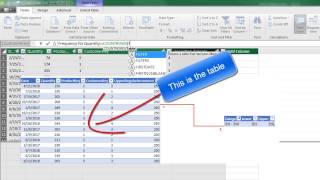
DAX Formulas for Running Total and % of Running Total & Other DAX Tricks
Master advanced DAX formulas for running totals, percentages, and data modeling in Excel. Learn to create relationships, use functions like CALCULATE and FILTER, and handle regular and irregular increments.
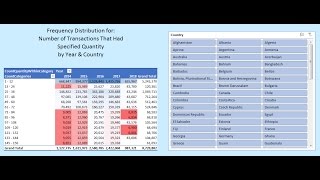
Data Model & DAX Formulas - Quantity Frequency Distribution by Year & Country
Learn to create a Data Model with DAX formulas for PivotTable frequency distributions, including conditional formatting and big data handling in Excel.
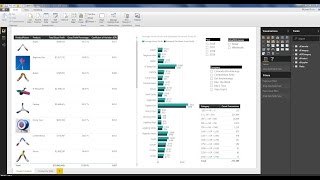
Power BI Desktop - Build Data Model, Get Data, DAX Formulas, Visualizations, Publish to Web
Comprehensive tutorial on building data models, creating DAX formulas, and designing visualizations in Power BI Desktop. Learn to import data, establish relationships, and publish interactive reports online.
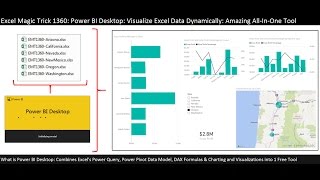
Comprehensive Power BI Desktop Example - Visualize Excel Data & Build Dynamic Dashboard
Learn to import, transform, and visualize Excel data in Power BI Desktop. Create dynamic dashboards with maps, charts, and slicers while mastering DAX calculations for insightful business analytics.
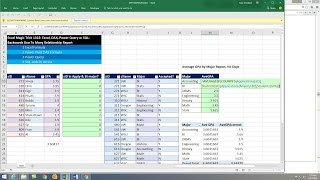
Backwards One to Many Relationship Report - Excel, Power Query or SQL?
Learn advanced Excel techniques for calculating average GPA across related tables using array formulas, DAX, Power Query, and SQL. Master data analysis skills for complex relationships.
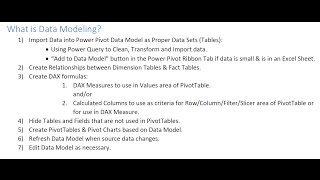
How to Build Data Model and DAX Formulas in Power Pivot
Master data modeling and DAX formulas in Power Pivot for Excel 2016. Learn to create relationships, calculated columns, and measures for powerful data analysis and visualization.
Basic Excel Business Analytics - Comprehensive PowerPivot, Data Model, DAX & Reporting Example
Comprehensive guide to PowerPivot: Import big data, build data models, create DAX measures, and generate insightful reports. Master advanced Excel analytics for business intelligence.
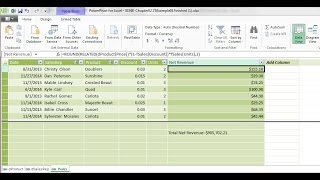
Basic Excel Business Analytics - Introduction to PowerPivot & Data Modeling
Comprehensive introduction to PowerPivot and data modeling in Excel, covering key concepts, DAX functions, and best practices for building efficient and effective data models for business analytics.
Two Fact Tables - DAX, Power Query or Worksheet Formulas to Convert to 1 Fact Table
Learn techniques to convert two fact tables into one using Excel formulas, DAX in Power Pivot, and Power Query in Power BI. Master data modeling and analysis skills for improved business reporting and decision-making.
Power Pivot - Big Data, Data Modeling, DAX & Dashboards
Aprenda a modelar dados, criar fórmulas DAX e construir dashboards usando Power Pivot. Importe dados SQL, crie tabelas de datas e explore recursos avançados para análise de negócios eficiente no Excel.
Data Modeling - VLOOKUP, Power Query or Power Pivot?
Learn data modeling techniques using VLOOKUP, Power Query, and Power Pivot for efficient data analysis in Excel. Explore methods for handling multiple tables and creating effective PivotTable reports.
Power BI Desktop Comprehensive Introduction - Power Query, DAX, Dashboards, Publishing
Comprehensive Power BI Desktop tutorial covering data import, DAX formulas, dashboard creation, and report publishing. Master essential skills for effective data analysis and visualization.
Comprehensive Introduction to Excel Power Pivot, DAX Formulas and DAX Functions
Comprehensive guide to Excel Power Pivot, DAX formulas, and functions. Learn data modeling, building relationships, and creating advanced calculations for powerful business intelligence dashboards.
Power Query Introduction - Importing & Transformation Data in Excel & Power BI Desktop
Comprehensive introduction to Power Query for data importing, cleaning, and transformation in Excel and Power BI Desktop, with practical examples and hands-on exercises.
Data Analysis Business Intelligence Terms - Microsoft Power Tools for Data Analysis Class
Comprehensive overview of data analysis and business intelligence concepts, including data types, models, and database structures for effective data management and analysis.
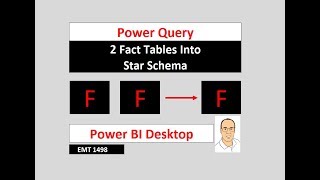
Power Query Power BI - Transform 2 Fact Tables to Star Schema Data Model - Invoice Data
Transform invoice data into a star schema using Power Query, creating a single fact table for improved reporting and analysis in Power BI Desktop.

Hack Data Model, Date Table & DAX Measures Without Buying Power Pivot
Master advanced Excel techniques: build data models, create DAX measures, and use functions like CALCULATE and TOTALYTD. Learn to optimize PivotTables and implement variables for efficient data analysis.

Python Django Tutorial for Beginners
Learn Django for backend development: create projects, apps, views, and data models. Master debugging tools and build production-grade web applications with Python.

Azure Cosmos DB - How to Design and Implement for SQL API
Explore Azure Cosmos DB SQL API design and implementation through demos, best practices, and monitoring techniques. Learn data modeling, query optimization, and issue identification for efficient database management.

Design a Data Partitioning Strategy
Explore advanced data partitioning strategies for Azure Cosmos DB, including denormalization, referential integrity, and entity combination to optimize performance and scaling.