UiPath - Robotic Process Automation RPA Basic Training
Learn UiPath RPA basics, including installation, PDF data extraction, loops, conditional statements, and data loading automation. Gain skills for UiPath certification and practical RPA implementation.
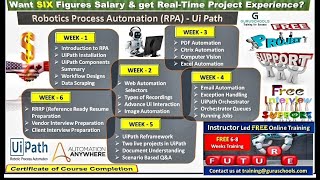
RPA Using UiPath
Master Robotic Process Automation with UiPath through hands-on training. Learn to automate business processes, increase efficiency, and gain valuable skills for the modern workplace.
Neo4j Health Care & Life Sciences Workshop
Explore graph databases in healthcare and life sciences, covering data science, knowledge graphs, drug discovery, clinical proteomics, and more for innovative research and decision-making.
Bite-Sized Neo4j for Data Scientists
Learn Neo4j for data science: connect to databases, use Python drivers, write Cypher queries, import data, perform graph analytics, and compare with SQL databases.
CAT Exam Preparation
In this course, you will learn all about CAT preparation. Common Admission Test - CAT is the largest national level entrance test for MBA admission in IIMs and other top MBA colleges in India.

CAT Exam Preparation Strategy, Syllabus, Tips and Tricks
In this course, you will learn all about CAT preparation. Common Admission Test - CAT is the largest national level entrance test for MBA admission in IIMs and other top MBA colleges in India.

Matplotlib Tutorial
Learn to create and customize various data visualizations using Python's Matplotlib library, from basic plots to real-time data representation and subplots.
Data Visualization with Matplotlib for Beginners
Learn to create diverse, professional-looking visualizations using Matplotlib, from installation to advanced techniques like annotations and style sheets.

NumPy in Python Tutorial
Learn essential NumPy concepts for Python, including array creation, manipulation, and operations. Master multi-dimensional arrays, reshaping, and slicing techniques for efficient data handling.

NumPy Data Science Essential Training With Python 3
Master NumPy for data science: arrays, indexing, computation, visualization, and statistical analysis. Hands-on practice with Python 3 and Jupyter Notebook for real-world applications.
Data Analytics with Python
Learn data analytics using Python, covering preprocessing, visualization, machine learning algorithms, and practical examples. Gain skills to analyze datasets, make predictions, and compete on Kaggle.

Data Visualization GUIs with Dash and Python
Learn to create interactive data visualization interfaces using Dash and Python, covering dynamic graphs, live updates, sentiment analysis, and app deployment for effective data presentation.
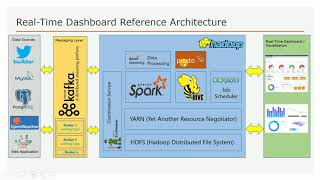
Apache Spark, Hadoop Project with Kafka and Python - End to End Development
Comprehensive big data project integrating Apache Spark, Hadoop, Kafka, and Python for end-to-end development, including streaming, REST API, and dashboard creation.
Dash Bootstrap
Learn to create interactive dashboards using Dash Bootstrap, covering styling, components, and advanced features for data visualization and user interaction.

Plotly Dash Components
Explore Plotly Dash components for interactive data visualization. Learn to create dropdowns, sliders, graphs, and more for building dynamic web applications with Python.
Pandas Tutorial - Data Analysis in Python
Learn data analysis with Python's Pandas library. Covers DataFrame basics, data handling, grouping, merging, pivoting, time series analysis, and memory optimization for large datasets.
Pandas Tutorials
Comprehensive guide to data analysis with Pandas: from basics to advanced techniques, covering installation, data manipulation, filtering, sorting, and working with various data sources.
CBSE Class 12 Informatics Practices
Comprehensive Python Pandas and data visualization course for CBSE Class 12 I.P., covering series, dataframes, matplotlib, SQL, and network concepts.
Python Pandas Complete Tutorial
Master Python Pandas for data analysis: filtering, sorting, aggregating, and visualizing data. Learn to handle missing values, create pivot tables, and work with various data formats.

Python Pandas Time Series Analysis
Learn to manipulate and analyze time series data using Python Pandas, covering DatetimeIndex, resampling, date ranges, holidays, datetime conversion, periods, timezones, and shifting techniques.

D3 Tutorial - The Basics
Learn D3.js basics: selecting elements, appending to the page, joining data, and controlling SVG shapes dynamically. Covers SVG fundamentals and data handling in D3.