
Learn Looker Studio - Beginner Course
Comprehensive tutorial on Looker Studio: build dashboards, explore data, and learn pro tips. From basics to advanced design, create eye-catching visualizations in just 47 minutes.

How to Create the Customer, Order & Category Resources in FilamentPHP - FilamentPHP for Beginners
Learn to create customer, order, and category resources in FilamentPHP. Master defining properties, columns, form fields, and implement features like search, sorting, and data summarization using wizards and repeater components.
How to Create Resource Modifiers and Resource Filters in FilamentPHP - FilamentPHP for Beginners
Learn to enhance FilamentPHP forms and tables with resource modifiers and filters. Master techniques for improved UI, data validation, and efficient data management in Laravel applications.
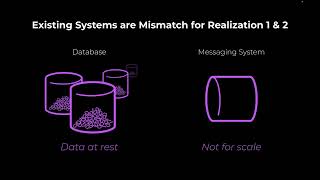
Leveraging Data in Motion in a Cloud-First World - Jun Rao
Explore Apache Kafka's journey, its cloud-native potential, and real-world applications. Learn how Fortune 100 companies leverage this platform for data-in-motion, revolutionizing data engineering and analytics workflows.
First Principles: Inside MySQL HeatWave Lakehouse on OCI
Explore MySQL HeatWave Lakehouse's innovative architecture, enabling efficient processing of massive datasets with advanced features like adaptive sampling, smart scheduling, and automated query optimization.

Modern SQL - Evolution of a Dinosaur
Explore SQL's evolution beyond relational algebra, featuring advanced capabilities like graph processing, XML/JSON handling, versioning, and time series analysis using modern techniques.
Removing Posts from Watch List - Android Classifieds App
Implement a watch list removal feature in an Android classifieds app using Firebase and ElasticSearch, enhancing user experience and functionality.

Learning Pandas - Start Here
Comprehensive overview of Pandas functionality, covering data I/O, DataFrame operations, filtering, statistics, grouping, and data manipulation techniques for efficient data wrangling and analysis.
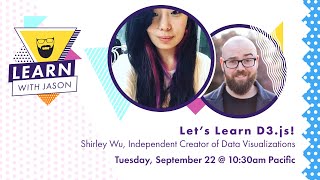
Let's Learn D3.js - Data Visualization with JavaScript
Learn to create interactive data visualizations with D3.js. Explore techniques for building dynamic, engaging charts and graphs using JavaScript and SVG in this hands-on tutorial.
Event Streaming Applications with Kafka - A Live Coding Session
Live coding session on event streaming with Kafka, covering Spring Kafka, Kafka Streams, and Spring Actuator. Learn to create consumers, producers, and streams for scalable, fault-tolerant applications with real-time monitoring.
Advanced Java Stream API Techniques - JetBrains Technology Day
Explore advanced Stream API tasks in Java, uncovering mysteries and solving complex scenarios beyond simple use cases. Gain insights into leveraging this powerful feature effectively.
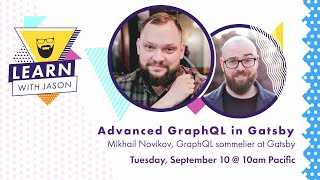
Advanced GraphQL Techniques in Gatsby - Learn With Jason
Explore advanced GraphQL patterns in Gatsby for powerful app and website creation. Learn to normalize data from different sources and combine data from multiple places in GraphQL nodes.
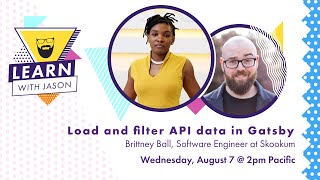
Loading and Filtering API Data in Gatsby - Learn With Jason
Learn to create a Gatsby source plugin and build a site using API data. Explore data loading, filtering, and practical application in this hands-on tutorial with Brittney Ball.
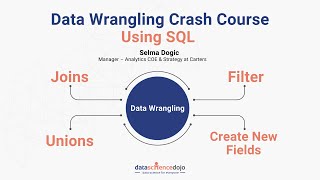
Data Wrangling Using SQL - Data Cleaning in SQL
Learn essential SQL data wrangling techniques for querying, joining, appending, filtering, and creating new fields in datasets. Gain practical skills to efficiently prepare and transform data for analysis.
Python Crash Course for Excel Users - Data Analysis with Python for Excel Users
Introduction to Python for Excel users, covering key concepts, tools, and applications for data analysis. Learn to leverage your Excel skills in Python for enhanced analytics and visualization.
Automated Web Scraping in R Using Rvest
Learn to automate web scraping in R for real-time data analysis. Covers periodic scraping, filtering timely content, text analysis, and setting up hourly email alerts for changing events and trends.
Introduction to Data Visualization with ggplot2
Learn to create powerful data visualizations using R's ggplot2 package. Master customization, choose optimal charts, leverage segmentation, and export high-quality graphics for analysis and presentations.
Feature Engineering - Introduction to Dplyr Part 4
Learn advanced dplyr techniques for feature engineering, including imputing missing values, creating new columns, and combining datasets. Master data manipulation skills to enhance your R programming toolkit.

Intro to Data Visualization with R and ggplot2
Learn to create powerful data visualizations using R and ggplot2. Master customization, choose optimal charts, leverage segmentation, and export high-quality graphics for impactful data analysis and presentation.

Introduction to R Programming for Excel Users
Learn to apply Excel skills in R programming for data analysis, visualization, and advanced techniques. Discover how Excel concepts translate to R, enabling powerful data manipulation and insights.
Intro to R Visualizations in Microsoft Power BI - R Visualizations in Power BI
Learn to create dynamic R visualizations in Power BI, enhancing data exploration and analysis capabilities. Hands-on introduction covers ggplot2, data preprocessing, and integrating R with Power BI's interface and controls.