GraphQL for Clinical Trial Matching - When GraphQL Outshines REST
Discover how GraphQL outperforms REST in clinical trial matching APIs, offering superior documentation, filtering, and mobile UI capabilities for efficient patient-trial pairing.

Open Source Challenges in the Enterprise - Mark Little, Red Hat Inc.
Explore enterprise open source challenges, benefits, and success factors. Gain insights into its impact on technology, industry adoption, and future implications for software development and innovation.
Build a Crypto Dashboard
Build a crypto dashboard using React and APIs. Learn to set up the project, integrate APIs, handle data, and style the interface. Includes tips on using .env files and suggestions for further development.
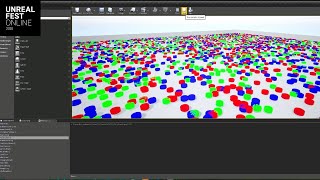
Speeding Up Game Logic in Unreal Engine - Unreal Fest Online 2020
Optimizing game logic for large-scale multiplayer titles using ECS, taskgraph extensions, and component-based processing to improve performance and enable automatic parallelization.
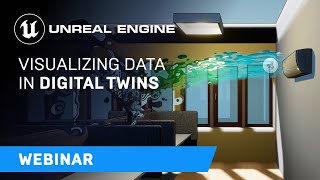
Visualizing Data in Digital Twins with Unreal Engine
Explore digital twin visualization using Unreal Engine, covering IoT sensors, particle systems, and the ADTLink plugin for real-time data analysis and optimization of 3D models.

Real-Time Real Estate - Visualize, Connect, Build
Industry experts discuss real-time technology's impact on real estate, exploring interactive visuals, data integration, and virtual experiences that revolutionize buyer engagement and property visualization.
Pandas Tutorial - Reading CSV Files with Various Parameters - Part 2
Learn to use Pandas for reading CSV files with various parameters, exploring functions and customization options to efficiently handle and analyze data in Python.
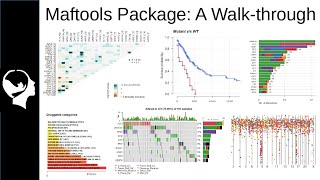
Cancer Somatic Mutation Analysis - MAFTOOLS R Package
Learn to analyze cancer somatic mutations using MAFtools R package. Covers importing data, visualization techniques, driver detection, survival analysis, and comparing cancer cohorts for comprehensive mutation insights.
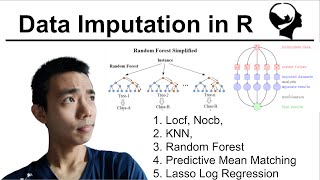
Dealing with Missing Data in R
Learn techniques for handling missing data in R, including various imputation methods, using packages like mice, and evaluating algorithm performance with ggplot2.
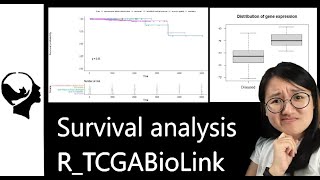
Survival Analysis on Cancer Data - RStudio Tutorial
Aprenda análise de sobrevivência em dados de câncer usando R. Tutorial prático sobre pipeline de análise, uso de dados TCGA, expressão gênica e modelagem preditiva para pesquisa biomédica.

Running Basic Statistical Analysis in R
Learn to perform essential statistical analyses in R, including correlation, linear modeling, t-tests, and heatmaps. Ideal for beginners seeking to leverage R's powerful command-line interface for data analysis.

Google Drive and Google Sheets in R - A RStudio Tutorial
Learn to efficiently use googledrive and googlesheets4 packages in R for seamless data management and analysis with Google Drive and Google Sheets.
How to Use Gganimate in R - A RStudio Tutorial for Beginners
Learn to create dynamic, animated data visualizations in R using gganimate. Master key functions and techniques for enhancing your data storytelling skills.
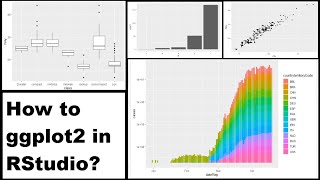
How to Use Ggplot2 in R - A Beginner's RStudio Tutorial
Learn to create data visualizations in R using ggplot2, from basic plots to advanced techniques. Covers installation, data understanding, and various plot types for effective data representation.
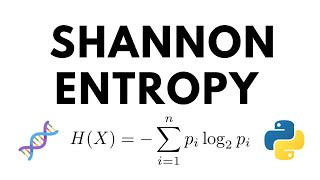
Shannon Entropy from Theory to Python
Learn to quantify information in sequences using Shannon Entropy. Explore the theory, formula, and Python implementation of this powerful information theory metric for data analysis and comparison.
Distance Metrics Explained and Visualized in Python
Explore five common distance metrics in Python, including theory, code, and visualizations. Learn how to choose and apply the right metric for better results in data analysis and machine learning.
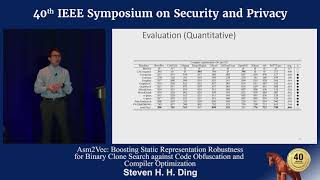
Asm2Vec - Boosting Static Representation Robustness for Binary Clone Search
Innovative assembly code representation learning model for robust binary clone search, addressing challenges in reverse engineering against code obfuscation and compiler optimization.
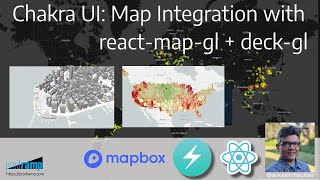
Chakra UI - MAP Integration in React with React-Map-GL and Deck-GL
Learn to integrate interactive maps in React applications using Chakra UI, react-map-gl, and deck.gl. Explore various map layers and visualizations for data-rich, visually appealing map interfaces.
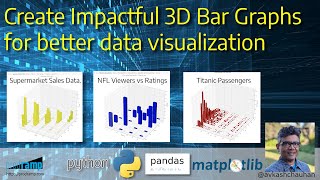
Create Impactful 3D Bar Graphs for Better Data Visualization
Learn to create impactful 3D bar graphs using Python libraries like Pandas and Matplotlib. Explore real-world datasets and master techniques for effective data visualization.
Mastering Pandas Groupby Method to Split and Combine Data and Apply Functions
Learn to expertly use pandas groupby for data manipulation, including splitting, combining, applying functions, and creating visualizations from grouped data.
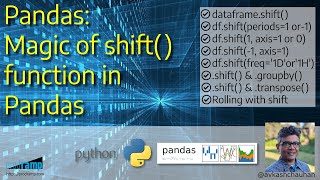
Python Pandas - Taking Advantage of Shift Method in Pandas to Process Rows and Columns
Learn to process Pandas DataFrames using shift() for row/column manipulation, timeseries updates, rolling calculations, and advanced data transformations in Python.