Cumulative Distribution Function - Numericals and Problems for BTech and BSc
Explore cumulative distribution functions (CDF) through practical examples, enhancing understanding of probability theory for engineering and science students.
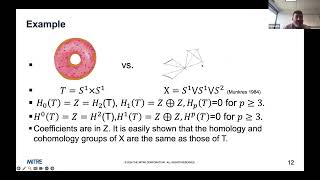
Steenrod Squares and Data Science - Exploring Connections in Algebraic Topology
Explore the potential link between advanced algebraic topology concepts and data science classification, examining how increasing algebraic complexity may solve harder geometric problems.

Insights into Search Interfaces for Mathematicians
Explore innovative search interfaces tailored for mathematicians, enhancing research efficiency and knowledge discovery in mathematical domains.
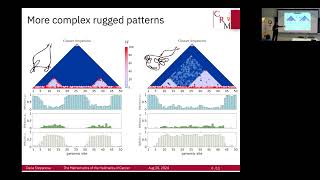
Modelling the Erosion of Epigenetic Landscapes in Cancer and Ageing
Explore mathematical models of epigenetic landscapes in cancer and aging, focusing on erosion processes and their implications for disease progression and cellular behavior.
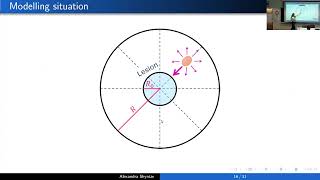
Mathematical Modelling of Microtube-Driven Regrowth of Glioma After Local Resection
Explore mathematical modeling of glioma regrowth post-resection, focusing on microtube-driven mechanisms and their impact on tumor recurrence and treatment strategies.
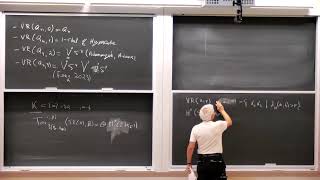
Some Remarks on the Cohomology of the Vietoris-Rips Complex of a Hypercube Graph
Explore advanced algebraic topology concepts, focusing on the cohomology of Vietoris-Rips complexes in hypercube graphs, with insights from expert Martin Bendersky.

Sampling a Discrete Random Variable
Explore techniques for sampling discrete random variables, enhancing statistical analysis skills and probability understanding.

Introduction to Variance - Defining the Formula - Part 3
Explore the formula for variance in statistics, understanding its components and application in measuring data spread and variability.

Introduction to Variance - Exploring with Technology (Part 1 of 3)
Explore variance concepts using technology in this engaging tutorial, enhancing understanding of statistical dispersion and data analysis techniques.

Expected Value - Non-uniform Probability Distributions
Explore non-uniform probability distributions and their impact on expected value calculations, enhancing your understanding of statistical concepts.

Expected Value - The $10 Bet (Part 1 of 2)
Explore the concept of expected value through a $10 bet scenario, gaining insights into probability and decision-making in uncertain situations.

Discrete Random Variables - Introduction
Introduction to discrete random variables, exploring their definition, properties, and applications in probability theory and statistics.
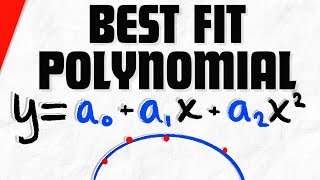
Least Squares Fit of a Polynomial - Linear Algebra
Learn to determine polynomial coefficients for best-fit curves using least squares method. Practical example with quadratic fit for four data points, covering system equations, normal equation, and result interpretation.
Cause and Effect - Understanding Causation in Scientific Research
Exploring causal inference methods in epidemiology and their impact on scientific understanding, challenging traditional views on correlation vs. causation in data analysis.
Making the World Add Up - Statistics and Media with Tim Harford
Economist Tim Harford discusses his book on statistical literacy, exploring media misuse of numbers and empowering listeners to critically evaluate data in everyday life.
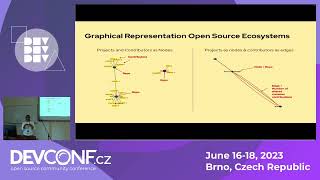
Uncovering New Open Source Communities Graphically
Explore graph theory techniques to visualize and analyze open source ecosystems, uncovering emerging communities and their relationships to established projects.
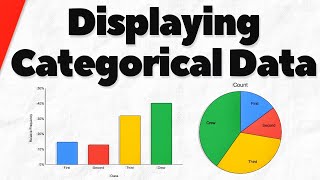
Bar Charts and Pie Charts for Categorical Data in Statistics
Learn to create and interpret bar charts and pie charts for categorical data, exploring frequency tables and comparing visualization methods.
Graphs in the Modern World: Analyzing Infectious Disease Dynamics
Explore graph-based models for analyzing infectious diseases, from deterministic compartmental models to agent-based simulations in modern epidemiology.
Beyond the Basics of Graphs and Networks
Explore advanced concepts in graph theory and network analysis, delving into complex structures and algorithms for deeper insights into interconnected systems.
Nutrients by the Numbers - Statistical Analysis of Food and Nutrient Data
Explore statistical analysis of food and nutrient data relationships, visualize distributions through informative plots and histograms with Gay Wilson.
Wolfram Language for Python Users: Enhancing Python Workflows
Explore how Wolfram Language and Python can work together, enhancing computational capabilities in data science and mathematics. Learn unique approaches and benefits for solving practical problems.