Visualization Techniques for Data Analysis - Session 20
Explore data visualization techniques and best practices for effectively communicating complex information through visual representations.
How to Interpret, Motivate, and Share OSS Community Health Findings - Keynote
Explore strategies for interpreting, improving, and communicating open-source community health findings within organizations, enhancing collaboration and project success.

Covering 2020 - Lessons for Press and Pollsters from 2016 Election
Exploring media coverage and polling in 2016 elections, discussing improvements for future reporting and predictions, and examining the role of news consumers in election years.
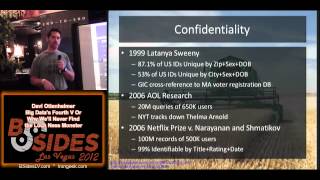
Big Data's Fourth V: Why We'll Never Find the Loch Ness Monster
Explore the concept of Big Data's fourth V and its implications for data analysis, using the Loch Ness Monster as an intriguing analogy to illustrate key principles.
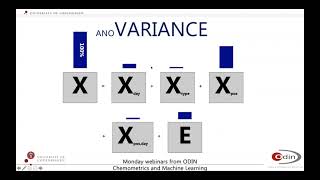
ASCA in One Hour
Explore Anova Simultaneous Components Analysis (ASCA), a powerful tool for analyzing multivariate data from designed experiments, in this comprehensive one-hour overview.
Tableau Business Intelligence - Beginner Tutorial for Dashboard Creation
Learn to create insightful Tableau dashboards with interactive visualizations, custom reports, and data analysis techniques for real-world business scenarios and effective decision-making.

LLMs in Data Analytics: Can They Match Human Precision?
Explore LLMs in data analytics with Gerard Kostin. Learn about DataGPT's tech stack, LLM capabilities, challenges, and integration with advanced algorithms for efficient data processing and interpretation.
Statistics Canada's Disaggregated Data Action Plan: Best Practices and Analytical Guidelines
Découvrez le plan d'action de Statistique Canada sur les données désagrégées, ses meilleures pratiques et ses défis pour une recherche systématique et éthique.

Covariance, Clearly Explained
Demystifies covariance, its calculation, and significance in statistics. Explores relationships between variables and sets the stage for understanding correlation.
Regression Analysis in Machine Learning - Linear Regression - Logistic Regression
Comprehensive exploration of regression analysis, covering linear and logistic techniques. Learn to leverage data relationships for informed decision-making in various business contexts.

The Medical Test Paradox and Redesigning Bayes' Rule
Explore the medical test paradox and a redesigned Bayes' rule, focusing on likelihood ratios and Bayes factors to enhance understanding of conditional probability in diagnostic testing.
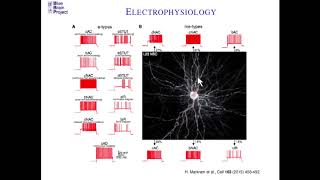
Kathryn Hess - Bedlewo: Topology Meets Neuroscience
Explore how topology applies to neuroscience across scales, from neurons to brain regions. Discover topological analysis of microconnectomes and neuron classification, with insights into brain imaging data.
Finding Z-Score, Percentiles and Quartiles, and Comparing Standard Deviation
Learn to calculate z-scores, interpret percentiles and quartiles, and compare standard deviations in this comprehensive statistics lecture, enhancing your data analysis skills.
The Shape of Data
Exploring how topology can extract new insights from abundant data, focusing on innovative applications of abstract mathematics to deepen our understanding of complex datasets.
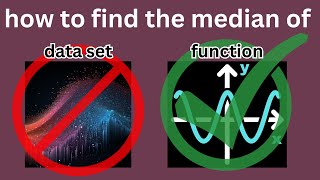
How to Find the Median of a Function
Learn to calculate the median of a function, exploring mathematical concepts and problem-solving techniques for this unique statistical measure.
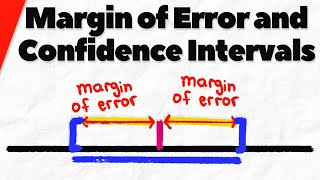
Margin of Error in Confidence Intervals - Statistics Guide
Comprehensive guide to calculating and interpreting margin of error in confidence intervals for various statistical scenarios, with practical examples and tips for adjusting sample size.

Making Sense of Your Data: Statistics and Machine Learning - Lecture 1
Explore statistical techniques and machine learning methods for data analysis in neutrino physics, enhancing your ability to extract meaningful insights from complex datasets.
Making the World Add Up - Statistics and Media with Tim Harford
Economist Tim Harford discusses his book on statistical literacy, exploring media misuse of numbers and empowering listeners to critically evaluate data in everyday life.
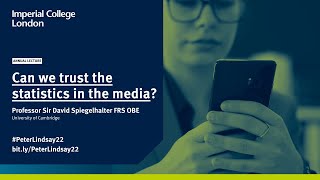
Can We Trust the Statistics in the Media? - The Peter Lindsay Memorial Lecture 2022
Explore how to critically evaluate statistics in media with Professor Sir David Spiegelhalter. Learn to distinguish between informative and persuasive use of numbers in various contexts.

A New View of the Universe from the Earth's South Pole - Naoko Kurahashi Neilson Public Lecture
Explore high-energy neutrino research at the South Pole, uncovering cosmic mysteries and advancing our understanding of the universe through innovative scientific collaboration and cutting-edge technology.

How to Look Inside a Volcano - with Christopher Jackson
Explore 3D seismic imaging techniques to uncover volcanic structures and evolution, offering insights into their internal composition and underlying 'plumbing systems'.