Power BI Desktop Comprehensive Introduction - Power Query, DAX, Dashboards, Publishing
Comprehensive Power BI Desktop tutorial covering data import, DAX formulas, dashboard creation, and report publishing. Master essential skills for effective data analysis and visualization.
Comprehensive Introduction to Excel Power Pivot, DAX Formulas and DAX Functions
Comprehensive guide to Excel Power Pivot, DAX formulas, and functions. Learn data modeling, building relationships, and creating advanced calculations for powerful business intelligence dashboards.
Mysteries of VLOOKUP Function Revealed - Amazing Examples
Comprehensive tutorial on VLOOKUP function in Excel, covering 15 examples from basic to advanced usage, including exact and approximate matches, dynamic tables, and error handling.
Power BI M Code for Moving Annual Total - Custom Function Power Query Custom Column
Learn to create custom functions in Power BI for calculating Moving Annual Totals using M code. Master advanced data transformation techniques and optimize performance with table buffering.
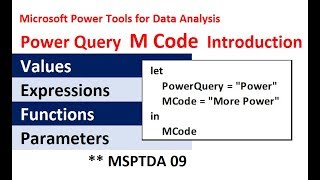
Power Query Complete M Code Introduction - Values, Let, Lookup, Functions, Parameters, More
Comprehensive introduction to M Code in Power Query, covering values, expressions, functions, and advanced techniques for efficient data manipulation and analysis.
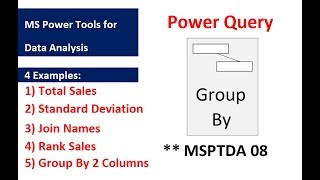
Power Query Group By Feature and Table.Group Function - Examples
Learn Power Query's Group By feature with five practical examples, including calculating totals, standard deviation, joining names, and ranking sales.
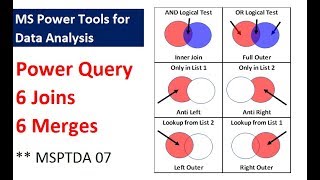
Power Query - 6 Types of Joins, 6 Types of Merges - 9 Examples
Explore Power Query's 6 types of joins and merges through 9 practical examples, enhancing your data analysis skills in Excel with step-by-step guidance.

Power Query - Excel.CurrentWorkbook Function to Append All Excel Tables in Excel Workbook
Master Excel's Power Query to efficiently append tables, handle recursion issues, and manipulate data using advanced functions like Excel.CurrentWorkbook and Table.ColumnNames.
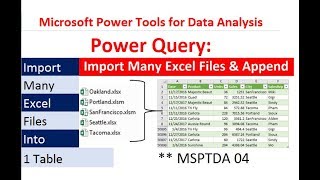
Power Query - Import Multiple Excel Files and Combine into Proper Data Set
Learn to import and combine multiple Excel files using Power Query, create a unified dataset, and build dynamic PivotTable reports with automated updates when new files are added.
Power Query Introduction - Importing & Transformation Data in Excel & Power BI Desktop
Comprehensive introduction to Power Query for data importing, cleaning, and transformation in Excel and Power BI Desktop, with practical examples and hands-on exercises.
Data Analysis Business Intelligence Terms - Microsoft Power Tools for Data Analysis Class
Comprehensive overview of data analysis and business intelligence concepts, including data types, models, and database structures for effective data management and analysis.
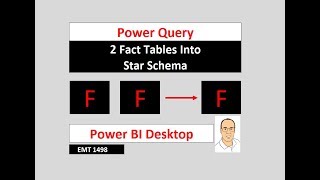
Power Query Power BI - Transform 2 Fact Tables to Star Schema Data Model - Invoice Data
Transform invoice data into a star schema using Power Query, creating a single fact table for improved reporting and analysis in Power BI Desktop.

Introduction to Power Query & Power Pivot Data Model in Excel 2016
Learn to clean data, create PivotTables, and use Power Query and Power Pivot in Excel 2016. Master data transformation, import large datasets, and build efficient data models for advanced analysis.

Hack Data Model, Date Table & DAX Measures Without Buying Power Pivot
Master advanced Excel techniques: build data models, create DAX measures, and use functions like CALCULATE and TOTALYTD. Learn to optimize PivotTables and implement variables for efficient data analysis.
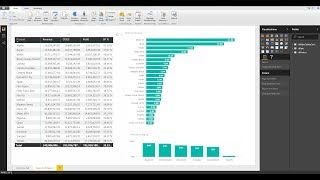
Power BI for Accountants - Complete Introduction to Power BI Desktop to Build Reports & Dashboards
Learn to create dynamic sales reports and dashboards using Power BI Desktop. Master data import, cleaning, transformation, and visualization techniques for effective financial analysis and monitoring.

Excel for Accountants - Power Query & PivotTables to Import & Clean Data and Build Reports
Learn to import, clean, and analyze data using Power Query and PivotTables. Master techniques for efficient data management, creating insightful reports, and optimizing file size in Excel for accounting purposes.
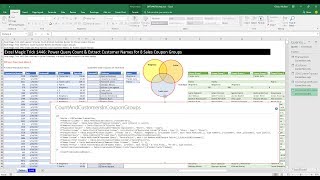
Power Query Count & Extract Customer Names for 8 Sales Coupon Groups
Learn advanced Power Query techniques to analyze customer coupon usage across multiple stores, including counting and extracting customer names for various coupon groups.
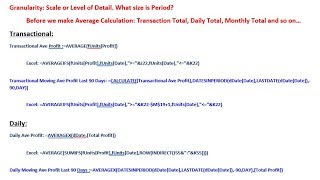
Average, Moving Average at Different Granularity - DAX or Excel Formulas
Learn advanced Excel and DAX techniques for calculating averages and moving averages at different granularities, enhancing your data analysis skills for more accurate financial reporting.
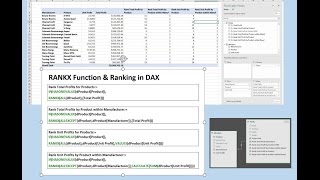
RANKX DAX Function and More - Ranking Profit for Products within Manufacturer
Aprenda a usar a função RANKX DAX para classificar lucros de produtos por fabricante em PivotTables do Excel. Domine técnicas avançadas de análise de dados e fórmulas DAX.

Excel Basics - Power Query (Get & Transform) to Clean & Transform Data into Proper Data Set
Learn to use Power Query in Excel for data cleaning, transformation, and analysis. Master importing, combining, and refreshing data from various sources to create proper datasets and pivot tables.

Linear Discriminant Analysis - Discriminant Analysis Tutorial - Machine Learning Tutorial
Explore Linear Discriminant Analysis for dimension reduction and pattern classification in machine learning. Learn its applications, core mathematics, and practical implementation through exercises and examples.