Debugging with Arduino - Part 2
Comprehensive seminar on Arduino debugging techniques using SEGGER tools, covering setup, configuration, and advanced features for efficient troubleshooting and code optimization.
Cross Debugging on Linux - History, Current State, and Future Improvements
Explore Linux cross-debugging history, current techniques, and future advancements. Learn about system modes, breakpoints, multithreading challenges, and alternatives to GDB/gdbserver.
Debugging Embedded Devices Using GDB
Learn to debug embedded devices using GDB, covering native and cross-compilation, remote debugging, breakpoints, and advanced GDB features for efficient troubleshooting on platforms like Raspberry Pi.
Modern JavaScript Debugging
Discover advanced JavaScript debugging techniques beyond basic alerts, including formatted console logs, various breakpoint types, and leveraging JavaScript's dynamic nature for efficient troubleshooting.
Journey to Highly Effective and Maintainable CSS Media Queries
Discover best practices for effective CSS media queries, including placement, maintainability, and mobile-first approaches to simplify code and enhance layout implementations.
Advanced Fiddler Techniques
Explore advanced Fiddler techniques for web diagnostics, including capturing traffic from various devices, manipulating requests, and using extensions for improved development and debugging.
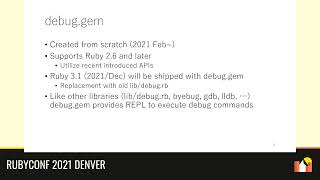
Debug.gem - Ruby's New Debug Functionality
Explore Ruby's new debug.gem: fastest debugger, remote debugging, VSCode integration, and advanced features for efficient development and troubleshooting.

Essential JavaScript Debugging Tools for the Modern Detective
Explore advanced JavaScript debugging techniques beyond console.log, including breakpoints, snippets, and source-map configurations, to enhance your problem-solving skills and code efficiency.
To Flexibly Tame Kernel Execution With Onsite Analysis
Explore OASIS, a framework for dynamic kernel analysis, enabling flexible control and data collection from kernel threads for various applications like memory introspection and malware testing.
bioMérieux and Breakpoints: Understanding FDA Submissions and Future Tools
Explore bioMérieux's commitment to public health, FDA submission processes, and future tools for antimicrobial and diagnostic stewardship. Learn about breakpoints, resources, and expert support available.

GHC Plugin for Setting Breakpoints in Concurrent Programs
Explore a GHC plugin for improved breakpoint functionality in concurrent programs, addressing limitations in GHCi's built-in debugger.
Infiltrator.jl - No-Overhead Breakpoints in Julia
Explore Infiltrator.jl, a Julia debugging tool offering interactive breakpoints without runtime overhead. Learn its implementation and common workflows for efficient package and application debugging.

Python Debugger Mechanics and Optimization - From sys.settrace to PEP 669
Explore Python debugger mechanics, from sys.settrace to PEP 669's low-cost monitoring system. Learn how debuggers work and discover potential 100x speedup for breakpoints in Python 3.12.

Python Debugger Mechanics and Optimization - From sys.settrace to PEP 669
Explore Python debugger mechanics, from sys.settrace to PEP 669's low-cost monitoring system. Learn how debuggers work and discover potential 100x speedup for breakpoints in Python 3.12.

IntelliJ Debugger Tips and Tricks
Discover advanced debugging techniques in IntelliJ IDEA to enhance your Java development skills and boost productivity.
Debug Now! Zap Bugs Out of PowerShell - Lecture 39
Aprende técnicas avanzadas de depuración para eliminar errores en PowerShell y mejorar tus habilidades de resolución de problemas.
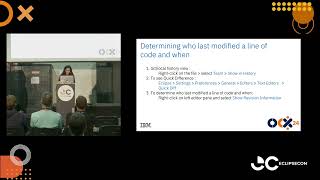
Mastering Eclipse IDE - Java Tooling Tips and Tricks
Master Eclipse IDE's advanced features, shortcuts, and productivity tools for Java development, from workspace customization to debugging tricks and modern Java module system integration.