Description:
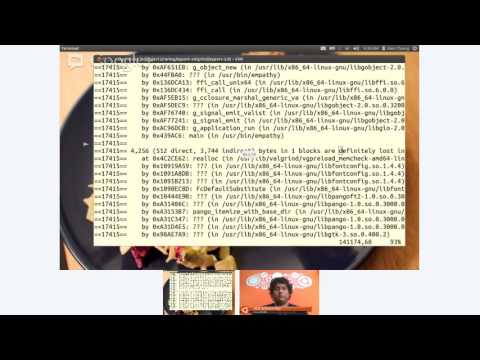
Discover effective techniques for identifying and resolving memory leaks in Ubuntu development during this one-hour tutorial. Learn to install and utilize Valgrind, a powerful tool for memory debugging and profiling. Explore topics such as extracting debs, handling connection problems, and using Cscope for code navigation. Gain insights into memory management with GSlice and understand algorithms for efficient memory allocation and deallocation. Engage in a Q&A session to address specific concerns and deepen your understanding of memory leak detection and resolution in Ubuntu development.

Finding Memory Leaks in Ubuntu Development
Add to list