Description:
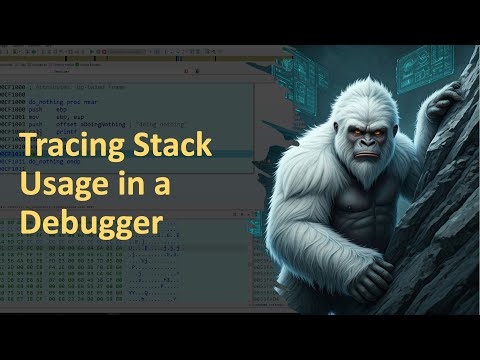
Explore stack usage and stack frames in a debugger through this 12-minute video tutorial. Trace function calls using a simple program and IDA's built-in debugger to observe how the stack operates in real-time. Focus on calling conventions and stack frames, examining their behavior as functions are called and unwound. Begin with starting a debug session, then learn about pushing arguments onto the stack. Proceed to analyze the process of calling another function, and conclude by understanding the epilogue. Gain practical insights into cybersecurity, reverse engineering, and malware analysis techniques through this hands-on demonstration.

Tracing Stack Usage and Stack Frames in a Debugger
Add to list