Description:
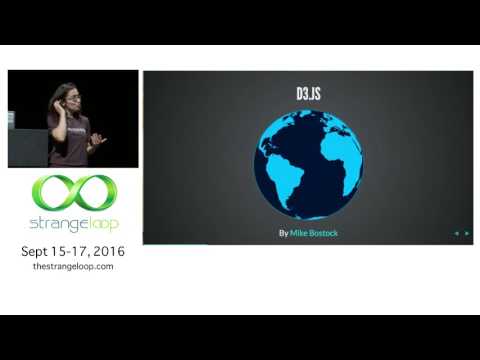
Explore data visualization techniques using Angular2, ngAnimate, RxJS, and change detection in this 38-minute conference talk from Strange Loop. Learn how to create interactive, high-performance storytelling visualizations at 60fps while leveraging Angular2's improved tools and performance. Discover app structure, animations, components, scaling, and more as presented by Aysegul Yonet, a Senior Software Engineer at Autodesk A360 Cloud Platform and Google Developer Expert. Gain insights into open-source communities, migration strategies, and practical resources for enhancing your data visualization skills in web development.

Storytelling with Your Data
Add to list
#Conference Talks
#Strange Loop Conference
#Data Science
#Data Visualization
#Programming
#Programming Languages
#Javascript
#D3.js
#RxJS