Description:
Discover the power of pandas-profiling in this comprehensive 33-minute video tutorial. Learn how to generate detailed, interactive reports for your datasets with just a few lines of code. Explore the library's capabilities through hands-on demonstrations using the Titanic dataset, covering interactions, correlations, missing values, and more. Master advanced features like configuring metadata, customizing report details, and integrating profiling reports into Streamlit applications. Gain valuable insights into handling large datasets and optimizing profiling settings for efficiency. By the end of this tutorial, you'll be equipped to streamline your data analysis workflow and extract meaningful insights from your pandas datasets with ease.
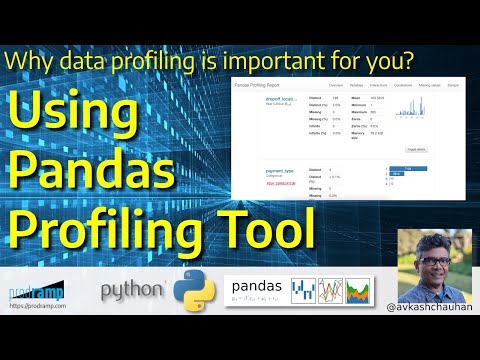
Python Pandas Profiling - Why Data Profiling Is Important for You
Add to list
#Programming
#Programming Languages
#Python
#pandas
#Data Science
#Data Analysis
#Data Visualization
#Jupyter Notebooks
#Streamlit
#Computer Science
#Information Technology
#Data Management
#Data Profiling