Description:
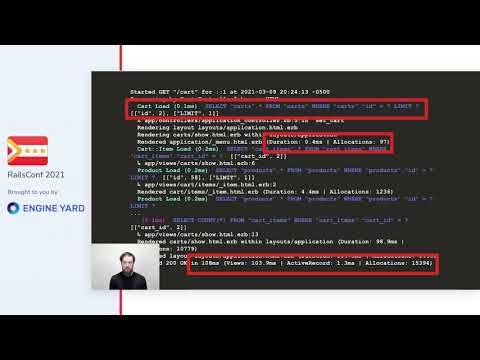
Learn how to identify and optimize slow code in your Rails application through profiling techniques. Explore tools like rack-mini-profiler and benchmark/ips, and discover best practices for performance optimization. Dive into database and memory profiling, understand retained vs allocated memory, and master call stack profiling. Examine profiling modes, flame graphs, and the differences between development and production environments. Gain insights into profiling with Speedscope, profiling boot autoloading, and conducting benchmarks effectively using BenchmarkIPS.

Profiling to Make Your Rails App Faster
Add to list
#Conference Talks
#Programming
#Programming Languages
#Ruby
#Ruby on Rails
#Software Development
#Software Testing
#Performance Testing
#Benchmarking
#Memory Profiling