Description:
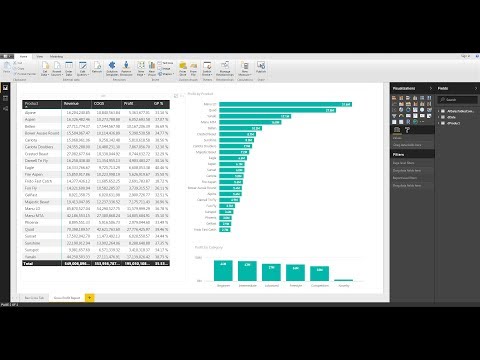
Learn to harness the power of Power BI Desktop for accounting in this comprehensive video tutorial. Master the process of cleaning and transforming data to create dynamic sales dashboards. Import and consolidate multiple text files into a single, easily updatable table for efficient reporting. Explore essential topics including data importation, cleaning techniques, relationship building, DAX functions for calendar tables and calculated columns, cross-tabulated reporting, and interactive dashboard creation. Gain practical skills in visualizing data with column and bar charts, implementing slicers, and updating dashboards with new data. Perfect for accountants looking to enhance their data analysis and visualization capabilities using Power BI Desktop.
Power BI for Accountants - Complete Introduction to Power BI Desktop to Build Reports & Dashboards
Add to list
#Business
#Business Intelligence
#Microsoft Power BI
#Data Science
#Data Analysis
#Data Cleaning
#Data Processing
#Data Transformation
#Power BI Desktop