Главная
Study mode:
on
1
) Files to download
2
) Introduction
3
) Import Related Tables from Access
4
) Edit automatic Relationships Bi-directional Filtering to Single-directional Filtering
5
) Import Text Files From Folder
6
) Filter out file extensions that are NOT Text .txt
7
) Use “Combine Binary” Icon to combine Text Files into one table
8
) Look at “Combine Binary”: Query Creation Steps, including M Code and Power Query Function that is automatically created
9
) Change Data Types in fSales (Fact Sales) Table
10
) edit Relationship between fSales Product Table
11
) Create Calendar Table in Excel
12
) Create Frequency Distribution Category Table in Excel using Text Formula
13
) Import tables from Excel File
14
) Manually Create Relationships Between Tables
15
) Create DAX Calculated Column for Net Revenue using the RELATED function (works like VLOOKUP Exact Match in Excel) & ROUND function. Net Revenue values are stored in the “In RAM Memory” Data Model
16
) Discuss Convention for using Columns in formulas: ALWAYS USE TABLE NAME AND COLUMN/FIELD NAME IN SQUARE BRACKETS
17
) Look at How REALTED works across relationships
18
) Discussion of Row Context
19
) Create Measure for Total Revenue. This Measure is a Measure that is based on values in a Calculated Column
20
) Add Number Format to Measure so that every time the Measure is used the Number Format will appear
21
) Learn about Measures that are not dependent on Calculated Columns. See how to create Measure that does not use a Calculated Column as a source for values. UseSUMX function
22
) Compare creating: 1) Measures based on Calculated Columns and or Measures not based on Calculated
23
) Discussion of Filter Context and how it helps DAX formulas calculate Quickly on Big Data. Filter Context: When a Conditions or Criteria are selected from the Lookup Tables (Dimension Tables) they f…
24
) Discussion of how values created in Calculated Colum are stored in the Data Model Columnar Database and this uses RAM Memory
25
) When you must use a Calculated Column: When you need to extend the data set and add a column that has Conditions or Criteria that you want to use to Filter the Data Set
26
) Create Calculated Column For COGS using ROUND and RELATED Functions
27
) Create Calculated Column for Gross Profit
28
) Create Calculated Column on fSales Table that will create the Sales Categories “Retail” or “Wholesale” using IF & OR functions. Because it creates Criteria that will use as Filters for our Measures…
29
) Measure for Total COGS
30
) Measure for Total Gross Profit
31
) Measure for Gross Profit Percentage. This is a Ratio of two numbers. This is an example of a Measure that can ONLY be created as a Measure. It cannot be created as a Measure based on a Calculated C…
32
) Discuss Convention for using Measures in other Measures: USE SQUARE BRACKETS ONLY around the Measure name
33
) Measure for Average (Mean) Gross Profit
34
) Measure for Standard Deviation of the Gross Profit
35
) Measure for Coefficient of Variation of the Gross Profit
36
) Hide Unnecessary Columns from Report View
37
) Sort Month Name Column by Month Number
38
) Sort Category Column By Lower Limit
39
) Add Data Category Image URL for Image File Paths
40
) Create DAX Column to simulate Approximate Match Lookup using the FLOOR function
41
) Manually Create Relationship For Category Table
42
) Update Excel Table and Test to see if Power BI Report Updates when we Refresh
43
) Create Product Analysis Visualization with the first visualization: Create Table with Product Pictures and Metrics. This is Page one of our Power BI Report.
44
) Create Bar Chart For Mean and Standard Deviation of Gross Profit
45
) Create Slicers to Filter Visualizations
46
) Create Frequency Distribution Table & Measure to Count Transactions
47
) Format Table, Chart and Slicers
48
) Create second Page in Power BI Report with Product Revenue and COGS by Year & Month
49
) Publish Power BI Report online
50
) Generate Embed code for e-mailing Report and for embedding in web sites
51
) Summary
Description:
Dive into a comprehensive 1-hour 12-minute tutorial on Power BI Desktop, focusing on building a product analysis for gross profit. Learn to import data from various sources, create and edit relationships, and develop DAX formulas for calculated columns and measures. Master the creation of visualizations, including tables with product pictures, bar charts, and slicers. Explore advanced concepts like filter context, row context, and the differences between calculated columns and measures. Gain practical skills in formatting, sorting, and adding data categories. Conclude by publishing your Power BI report online and generating embed codes for sharing. This in-depth guide covers everything from basic data modeling to advanced DAX formulas and visualization techniques, providing a solid foundation for creating powerful business intelligence reports.

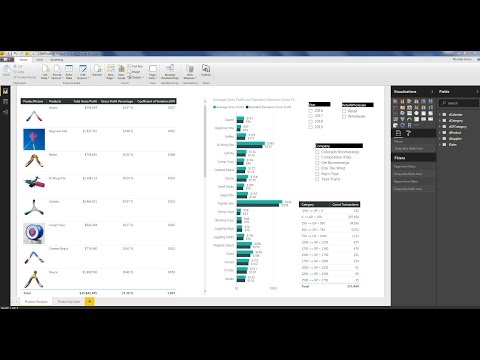
Power BI Desktop - Build Data Model, Get Data, DAX Formulas, Visualizations, Publish to Web

ExcelIsFun
Add to list