Description:
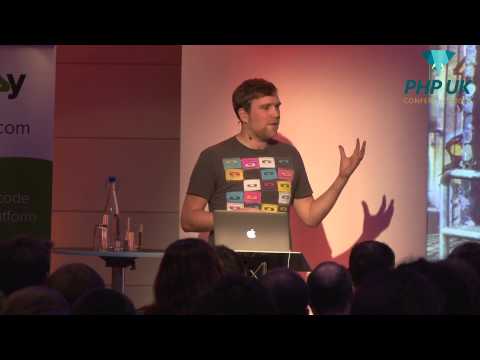
Explore profiling techniques and performance optimization strategies for PHP applications in this conference talk from PHP UK 2014. Learn how to measure web application performance, track user-perceived speed in the browser, and analyze issues using tools like Xdebug, XHProf, and the Symfony Debug Toolbar. Discover methods to decrease load times, including GZIP compression, database indexing, JS minification, proper caching headers, and asynchronous content loading. Gain insights into advanced techniques such as using Varnish, implementing pushState, and leveraging promises and futures to further enhance application speed and responsiveness.

Profiling PHP Applications
Add to list
#Conference Talks
#PHP UK Conference
#Computer Science
#Load Balancing
#Programming
#Programming Languages
#PHP
#Xdebug